HOT TOPICS LIST
- MACD
- Fibonacci
- RSI
- Gann
- ADXR
- Stochastics
- Volume
- Triangles
- Futures
- Cycles
- Volatility
- ZIGZAG
- MESA
- Retracement
- Aroon
INDICATORS LIST
LIST OF TOPICS
PRINT THIS ARTICLE
by Donald W. Pendergast, Jr.
Up by 17% in nineteen days, shares of Southwest Airlines are now under distribution by the major players in the market.
Position: N/A
Donald W. Pendergast, Jr.
Freelance financial markets writer and online publisher of the Trendzetterz.com S&P 500 Weekly Forecast service.
PRINT THIS ARTICLE
TECHNICAL INDICATORS
LUV: Distribution Underway
08/29/14 03:36:06 PMby Donald W. Pendergast, Jr.
Up by 17% in nineteen days, shares of Southwest Airlines are now under distribution by the major players in the market.
Position: N/A
| Shares of Southwest Airlines (LUV) have begun to level off after reaching a lofty cruising altitude; after putting in a multicycle low on August 8, 2014 the stock proceeded to rally steadily, going from 27.42 to 32.25 in 2 1/2 weeks. Here's a look at a unique way to help identify distribution patterns using tick charts to help anticipate trend reversals that pave the way for short-term swing trading opportunities. |

|
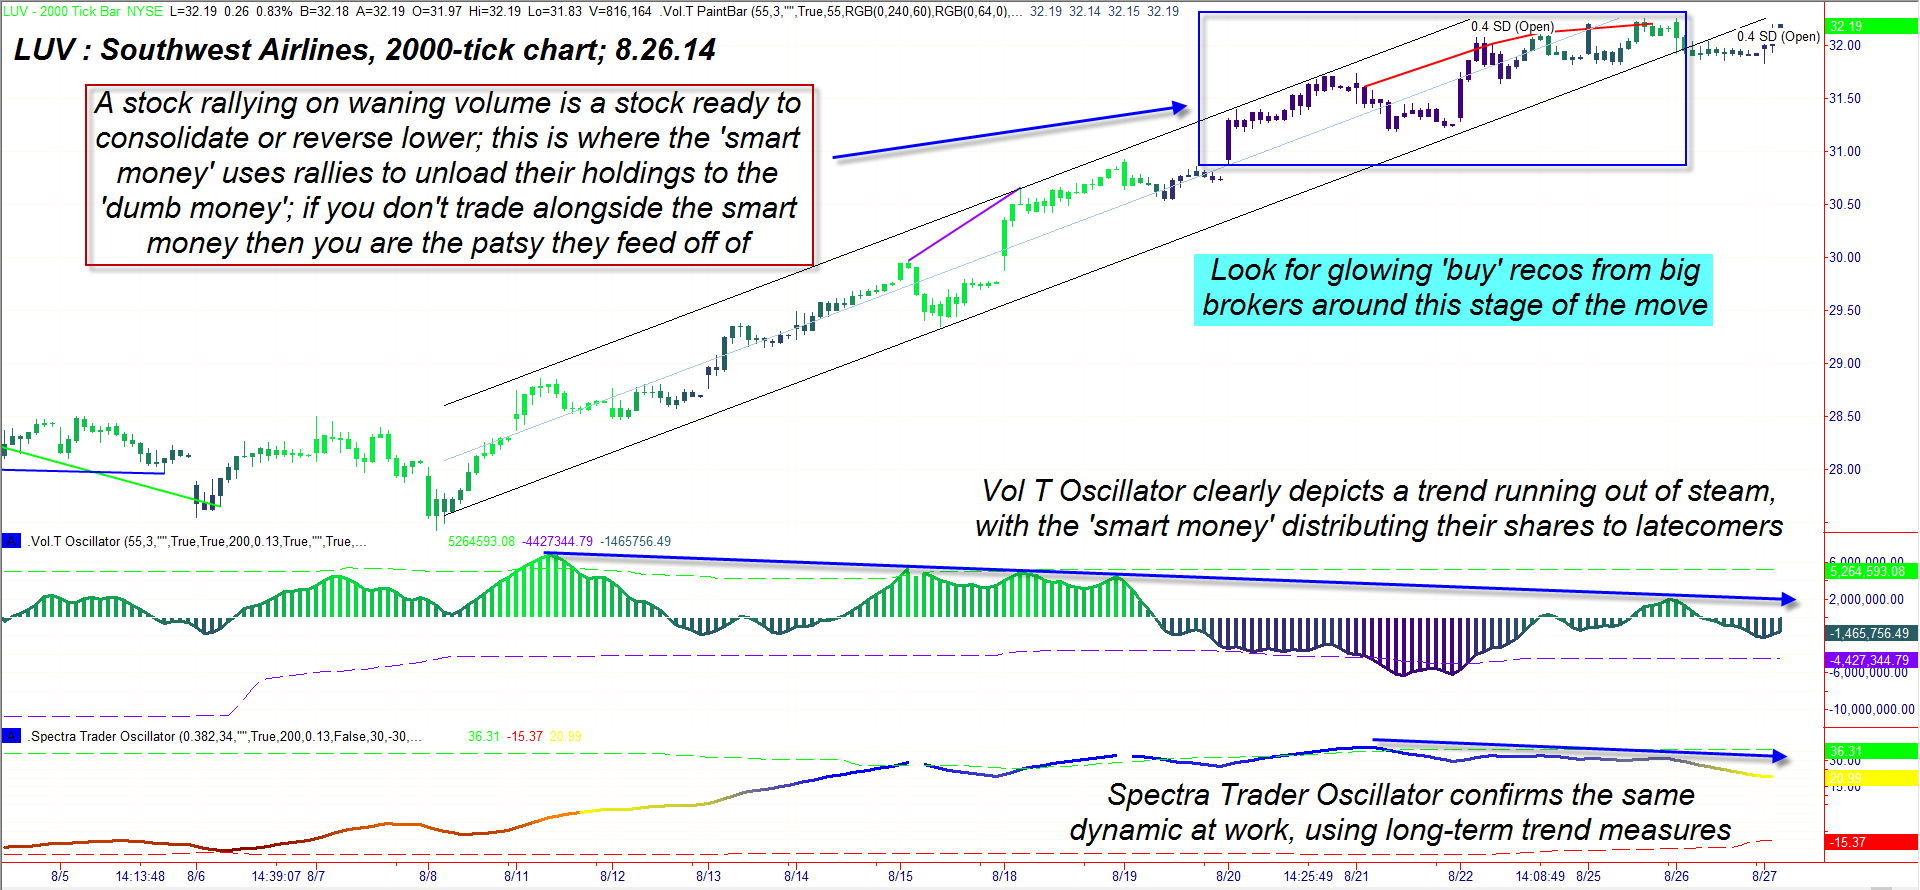
| Figure 1. Southwest Airlines (LUV); If you look at the chart and indicators and read carefully, you may learn more about the true nature of Wall Street from this one image than you will by reading a library full of academic research tomes. Just sayin'... |
| Graphic provided by: TradeStation. |
| Graphic provided by: Elite Trader Indicators by Fibozachi.com. |
| |
| The main advantage of using tick charts (a 2000 tick bar/candle represents 2000 trades) is that they can often help smooth out swing/trending moves to a degree not possible when using a fixed time-based bar or candle; as a result, when significant increases in volume and/or number of trade transactions become apparent, a trader can act more quickly, stay with a swing longer and exit earlier than would be possible when using a time-based bar. There are times when using a time-based bar might not offer an edge — especially when trading a daily time frame or higher, but for day traders and swing traders used to 5-, 15-, 30- or 60-minute charts, switching to tick charts can be a big plus, particularly if a stock has a tendency to move in well-defined thrusts — higher or lower. Shown in Figure 1 is a 2000-tick chart for LUV; depending on the relative amount of bullish/bearish enthusiasm in the stock at any given time, the tick charts typically provide an easier framework for day/swing traders to identify high-probability, low-risk entries. There are two indicators and one custom paint bar applied to the chart: 1. Vol T oscillator 2. Spectra Trader oscillator 3. Vol T paint bar When the Vol T oscillator is above its zero line, the trading volumes per transaction are increasing, making it an opportune time to be long; when the paint bar colors move from dark blue to lime green, that is also a visual confirmation of the same bullish volume/tick dynamic at work. Finally, the Spectra Trader oscillator (bottom of chart) gives a longer-term perspective of the underlying trend of the stock. As a general rule, it pays to trade on the same side as all three indicators, being sure to note times when pronounced divergences begin to manifest. For example, note how the Vol T oscillator histogram peaked out early in the move out of the August 8, 2014 cycle low and that the second cluster of peaks in mid-August weren't as tall — suggesting that at least some smart money players were beginning to lighten up on their holdings. In fact, since August 19, 2014, the oscillator has spent 85% of the time below its zero line, confirming that steady distribution was underway. The Spectra Trader oscillator peaked on August 21, 2014 and has been trending lower for the past five trading sessions, thus confirming distribution from a completely different angle. Note that LUV was still grinding higher all the while, even as the smart money (major institutions) was heading for the exits. The color of the tick bars will exactly mimic the color of the Vol T oscillator, by the way. On August 26, 2014, LUV finally broke down from its linear regression channel and is still in close proximity to it. Now, none of this is implying a major shorting op in LUV at the moment; however, the two indicators, paint bar, and linear regression channel all worked together to alert existing longs that the uptrend was progressively losing steam and that scaling out or running closer stops was highly advisable. |

|
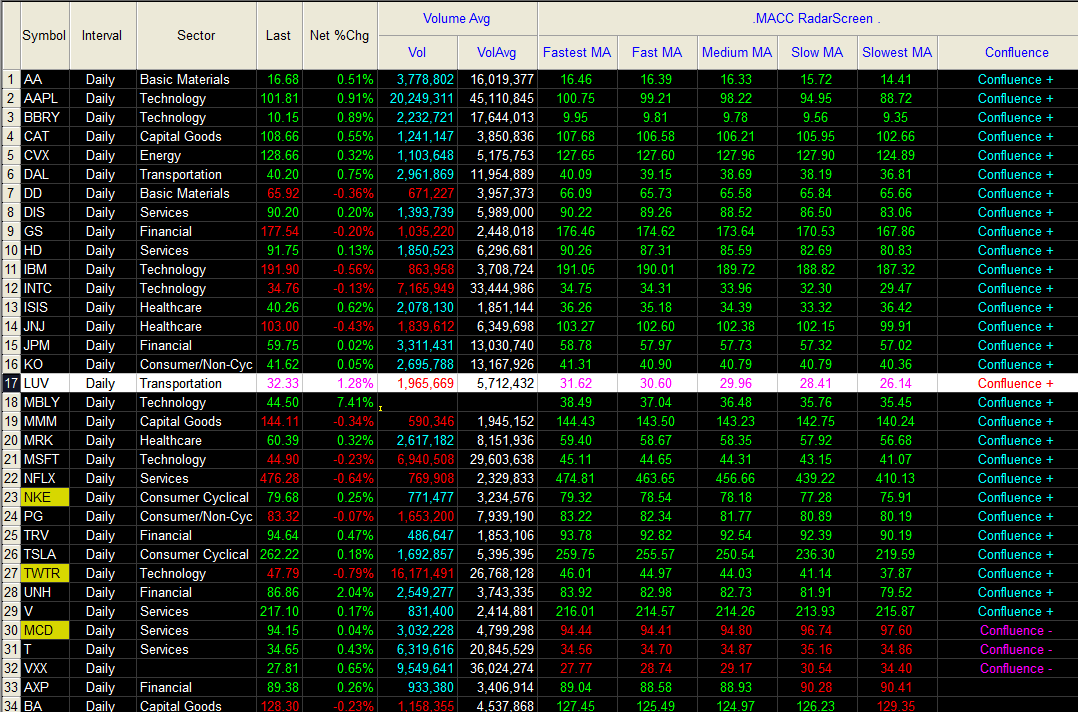
| Figure 2. The ratio of bullish/bearish moving average confluences among big-name stocks is tilted toward an absurdly bullish extreme at the moment. Another round of retail investor 'sheep shearing' approacheth. |
| Graphic provided by: TradeStation. |
| Graphic provided by: TradeStation RadarScreen. |
| |
| This is only one of a myriad number of ways to use tick charts and technical indicators in a swing trading methodology, but it does appear to have great potential in the hands of a disciplined, dedicated trader. Learning to view the markets you trade in terms of tick and volume activity in lieu of fixed-time bars or candles may well be worth your time. Trade wisely until we meet here again. |
Freelance financial markets writer and online publisher of the Trendzetterz.com S&P 500 Weekly Forecast service.
| Title: | Market consultant and writer |
| Company: | Trendzetterz |
| Address: | 81 Hickory Hollow Drive |
| Crossville, TN 38555 | |
| Phone # for sales: | 904-303-4814 |
| Website: | trendzetterz.com |
| E-mail address: | support@trendzetterz.com |
Traders' Resource Links | |
| Trendzetterz has not added any product or service information to TRADERS' RESOURCE. | |
Click here for more information about our publications!
PRINT THIS ARTICLE

Request Information From Our Sponsors
- VectorVest, Inc.
- Executive Premier Workshop
- One-Day Options Course
- OptionsPro
- Retirement Income Workshop
- Sure-Fire Trading Systems (VectorVest, Inc.)
- Trading as a Business Workshop
- VectorVest 7 EOD
- VectorVest 7 RealTime/IntraDay
- VectorVest AutoTester
- VectorVest Educational Services
- VectorVest OnLine
- VectorVest Options Analyzer
- VectorVest ProGraphics v6.0
- VectorVest ProTrader 7
- VectorVest RealTime Derby Tool
- VectorVest Simulator
- VectorVest Variator
- VectorVest Watchdog
- StockCharts.com, Inc.
- Candle Patterns
- Candlestick Charting Explained
- Intermarket Technical Analysis
- John Murphy on Chart Analysis
- John Murphy's Chart Pattern Recognition
- John Murphy's Market Message
- MurphyExplainsMarketAnalysis-Intermarket Analysis
- MurphyExplainsMarketAnalysis-Visual Analysis
- StockCharts.com
- Technical Analysis of the Financial Markets
- The Visual Investor
