HOT TOPICS LIST
- MACD
- Fibonacci
- RSI
- Gann
- ADXR
- Stochastics
- Volume
- Triangles
- Futures
- Cycles
- Volatility
- ZIGZAG
- MESA
- Retracement
- Aroon
INDICATORS LIST
LIST OF TOPICS
PRINT THIS ARTICLE
by David Penn
The bullish flag in the commodities index is back. Will higher commodity prices return, as well?
Position: N/A
David Penn
Technical Writer for Technical Analysis of STOCKS & COMMODITIES magazine, Working-Money.com, and Traders.com Advantage.
PRINT THIS ARTICLE
FLAGS AND PENNANTS
Back to the CRB's Bullish Flag
10/24/02 03:07:35 PMby David Penn
The bullish flag in the commodities index is back. Will higher commodity prices return, as well?
Position: N/A
| About a month ago, I wrote a piece called "A Bullish Flag in Commodities" (Traders.com Advantage, September 19, 2002) that suggested that, in spite of bearish signals in selected commodities (less than a week previous, I noted a top in corn--see "December Corn's 2B Test of Top", Traders.com Advantage, September 13, 2002), commodities looked poised for higher ground. |
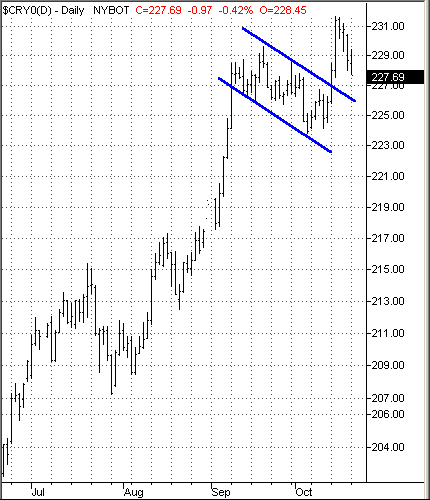
| Since that time, however, the CRB Index began moving more or less sideways--so much so that I began to doubt the initial flag, which was only about six or seven days long. Yet the CRB Index did not begin moving down appreciably; the Index was a 229 in mid-September and was only slightly below that point in mid-October. What began as a week-long flag appeared to have turned into a three-week long flag. This three-week long flag (and, yes, three weeks is nearing the upper time limit on flag formations) in fact yielded an upside break on October 14th and followed-through powerfully on the 15th. Since that time, the CRB Index has pulled back some, finding support near the area of the initial breakout from the formation. |

|
| A pullback in the wake of a powerful upside breakout from this longish bull flag. |
| Graphic provided by: TradeStation. |
| |
| Pullbacks from formations like flags (parallel trendlines) and pennants (converging trendlines) are not at all uncommon. In fact, for successful formations, such pullbacks can be excellent opportunities to initiate a trade that might have seemed too risky while the pattern was still unfolding. In the case of the CRB Index's bull flag presented here, the pullback from the breakout high of 231.60 back to the breakout area of 227 suggests that the price support at 227 remains strong. Trading the pullback with stop protection just beneath the breakout area is one common, relatively low-risk approach to taking advantage of chart pattern breakouts. |
| What sort of price target can be considered for this chart pattern? Price targets for flags are derived by measuring the distance from the formation to the most previous price base or consolidation, and adding that amount to the value at the breakout point. Here, the flag pattern begins at 227, after prices broke free from the consolidation at about 217. This gives a ten point distance which, when added to the value at the breakout point of 227, gives a minimum upside target of 237. This, incidentally, would take the CRB Index higher than it has been at any time since December 1997. |
Technical Writer for Technical Analysis of STOCKS & COMMODITIES magazine, Working-Money.com, and Traders.com Advantage.
| Title: | Technical Writer |
| Company: | Technical Analysis, Inc. |
| Address: | 4757 California Avenue SW |
| Seattle, WA 98116 | |
| Phone # for sales: | 206 938 0570 |
| Fax: | 206 938 1307 |
| Website: | www.Traders.com |
| E-mail address: | DPenn@traders.com |
Traders' Resource Links | |
| Charting the Stock Market: The Wyckoff Method -- Books | |
| Working-Money.com -- Online Trading Services | |
| Traders.com Advantage -- Online Trading Services | |
| Technical Analysis of Stocks & Commodities -- Publications and Newsletters | |
| Working Money, at Working-Money.com -- Publications and Newsletters | |
| Traders.com Advantage -- Publications and Newsletters | |
| Professional Traders Starter Kit -- Software | |
Click here for more information about our publications!
Comments
Date: 10/29/02Rank: 4Comment:
Date: 10/31/02Rank: 4Comment:

Request Information From Our Sponsors
- VectorVest, Inc.
- Executive Premier Workshop
- One-Day Options Course
- OptionsPro
- Retirement Income Workshop
- Sure-Fire Trading Systems (VectorVest, Inc.)
- Trading as a Business Workshop
- VectorVest 7 EOD
- VectorVest 7 RealTime/IntraDay
- VectorVest AutoTester
- VectorVest Educational Services
- VectorVest OnLine
- VectorVest Options Analyzer
- VectorVest ProGraphics v6.0
- VectorVest ProTrader 7
- VectorVest RealTime Derby Tool
- VectorVest Simulator
- VectorVest Variator
- VectorVest Watchdog
- StockCharts.com, Inc.
- Candle Patterns
- Candlestick Charting Explained
- Intermarket Technical Analysis
- John Murphy on Chart Analysis
- John Murphy's Chart Pattern Recognition
- John Murphy's Market Message
- MurphyExplainsMarketAnalysis-Intermarket Analysis
- MurphyExplainsMarketAnalysis-Visual Analysis
- StockCharts.com
- Technical Analysis of the Financial Markets
- The Visual Investor
