HOT TOPICS LIST
- MACD
- Fibonacci
- RSI
- Gann
- ADXR
- Stochastics
- Volume
- Triangles
- Futures
- Cycles
- Volatility
- ZIGZAG
- MESA
- Retracement
- Aroon
INDICATORS LIST
LIST OF TOPICS
PRINT THIS ARTICLE
by David Penn
The rally in commodities looks to continue after a brief consolidation in mid-September.
Position: N/A
David Penn
Technical Writer for Technical Analysis of STOCKS & COMMODITIES magazine, Working-Money.com, and Traders.com Advantage.
PRINT THIS ARTICLE
FLAGS AND PENNANTS
A Bullish Flag in Commodities
09/19/02 01:38:15 PMby David Penn
The rally in commodities looks to continue after a brief consolidation in mid-September.
Position: N/A
| Climb, commodities, climb ... After noting a bullish diamond pattern in the CRB Index in July (see my "Diamonds and the CRB," Traders.com Advantage, 8/16/02), I began wondering just how much more the commodities could rally. This became especially relevant as I saw the CRB Index running into long-term resistance in the form of the peaks left behind from the 1999 bull market in commodities (see my "Commodities: Soaring Toward Resistance?", Traders.com Advantage, 9/9/02). |
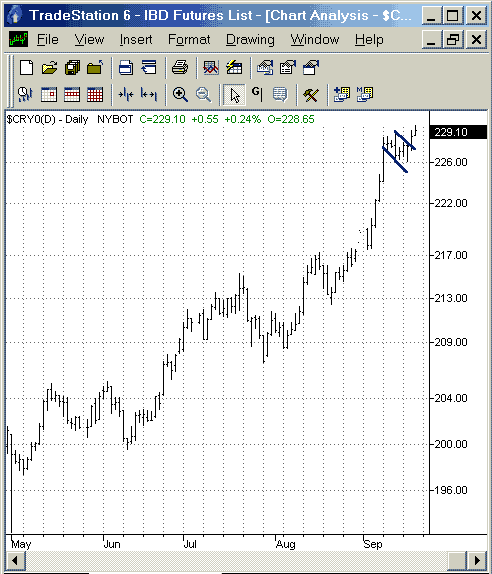
| Indeed, a number of commodities--from corn (see my "December Corn's 2B Test of Top", Traders.com Advantage, 9/13/02) to cotton--have been slipping, either by retreating from contract highs (corn, wheat) or in failing to break from consolidations on the upside (cotton and, to a lesser degree, crude oil). However, many of these retreats and sluggish breakouts might be better understood in the context of what appears to be a bullish flag in the CRB Index. This flag, which already appears to be breaking out on the upside, suggests that the short-term setbacks in the commodities--including, perhaps, crude oil futures that have been threatening to move above $30 per barrel--are just that: short-term. |

|
| This bullish flag suggests the CRB Index could move as high as 236. |
| Graphic provided by: TradeStation. |
| |
| The flag pattern is a short-term countertrend consolidation (more than three weeks is usually considered to be too long for a flag, for example) bound by parallel trendlines. In fact, the only thing that is "missing" from the flag in the CRB Index is evidence of declining volume--which is not readily available for the CRB Index. As such, we should be vigilant to the possibility of the flag's break to the upside suddenly failing and reversing. Here, I might add, the 2B test can be helpful in determining whether or not the CRB has topped, or is likely to move further up. |
| As far as the flag goes, the measurement rule for flags consists of adding the difference between the beginning of the trend that led into the formation (about 217) and the beginning of the formation itself (about 226) to the break point (about 227). This provides for an upside target of about 236. For those interested in trading CRB futures themselves, the November contract (CRX2) is traded on the NYBOT/NYFE. Initial margins are, as of this writing, $1,300, and a full one-point move in CRB futures is worth $500 per contract. Should the bullish flag in the CRB Index prove true, then the proposed 9-point move could result in a sizeable gain. |
Technical Writer for Technical Analysis of STOCKS & COMMODITIES magazine, Working-Money.com, and Traders.com Advantage.
| Title: | Technical Writer |
| Company: | Technical Analysis, Inc. |
| Address: | 4757 California Avenue SW |
| Seattle, WA 98116 | |
| Phone # for sales: | 206 938 0570 |
| Fax: | 206 938 1307 |
| Website: | www.Traders.com |
| E-mail address: | DPenn@traders.com |
Traders' Resource Links | |
| Charting the Stock Market: The Wyckoff Method -- Books | |
| Working-Money.com -- Online Trading Services | |
| Traders.com Advantage -- Online Trading Services | |
| Technical Analysis of Stocks & Commodities -- Publications and Newsletters | |
| Working Money, at Working-Money.com -- Publications and Newsletters | |
| Traders.com Advantage -- Publications and Newsletters | |
| Professional Traders Starter Kit -- Software | |
Click here for more information about our publications!
PRINT THIS ARTICLE

Request Information From Our Sponsors
- StockCharts.com, Inc.
- Candle Patterns
- Candlestick Charting Explained
- Intermarket Technical Analysis
- John Murphy on Chart Analysis
- John Murphy's Chart Pattern Recognition
- John Murphy's Market Message
- MurphyExplainsMarketAnalysis-Intermarket Analysis
- MurphyExplainsMarketAnalysis-Visual Analysis
- StockCharts.com
- Technical Analysis of the Financial Markets
- The Visual Investor
- VectorVest, Inc.
- Executive Premier Workshop
- One-Day Options Course
- OptionsPro
- Retirement Income Workshop
- Sure-Fire Trading Systems (VectorVest, Inc.)
- Trading as a Business Workshop
- VectorVest 7 EOD
- VectorVest 7 RealTime/IntraDay
- VectorVest AutoTester
- VectorVest Educational Services
- VectorVest OnLine
- VectorVest Options Analyzer
- VectorVest ProGraphics v6.0
- VectorVest ProTrader 7
- VectorVest RealTime Derby Tool
- VectorVest Simulator
- VectorVest Variator
- VectorVest Watchdog
