

HOT TOPICS LIST
- MACD
- Fibonacci
- RSI
- Gann
- ADXR
- Stochastics
- Volume
- Triangles
- Futures
- Cycles
- Volatility
- ZIGZAG
- MESA
- Retracement
- Aroon
INDICATORS LIST
LIST OF TOPICS
PRINT THIS ARTICLE
by Matt Blackman
As a number of macro indicators have hit extremes of late, here is another interesting signal to consider.
Position: N/A
Matt Blackman
Matt Blackman is a full-time technical and financial writer and trader. He produces corporate and financial newsletters, and assists clients in getting published in the mainstream media. He is the host of TradeSystemGuru.com. Matt has earned the Chartered Market Technician (CMT) designation. Find out what stocks and futures Matt is watching on Twitter at www.twitter.com/RatioTrade
PRINT THIS ARTICLE
BULL/BEAR MARKET
An Interesting Macro Market Risk Indicator
07/03/14 05:09:05 PMby Matt Blackman
As a number of macro indicators have hit extremes of late, here is another interesting signal to consider.
Position: N/A
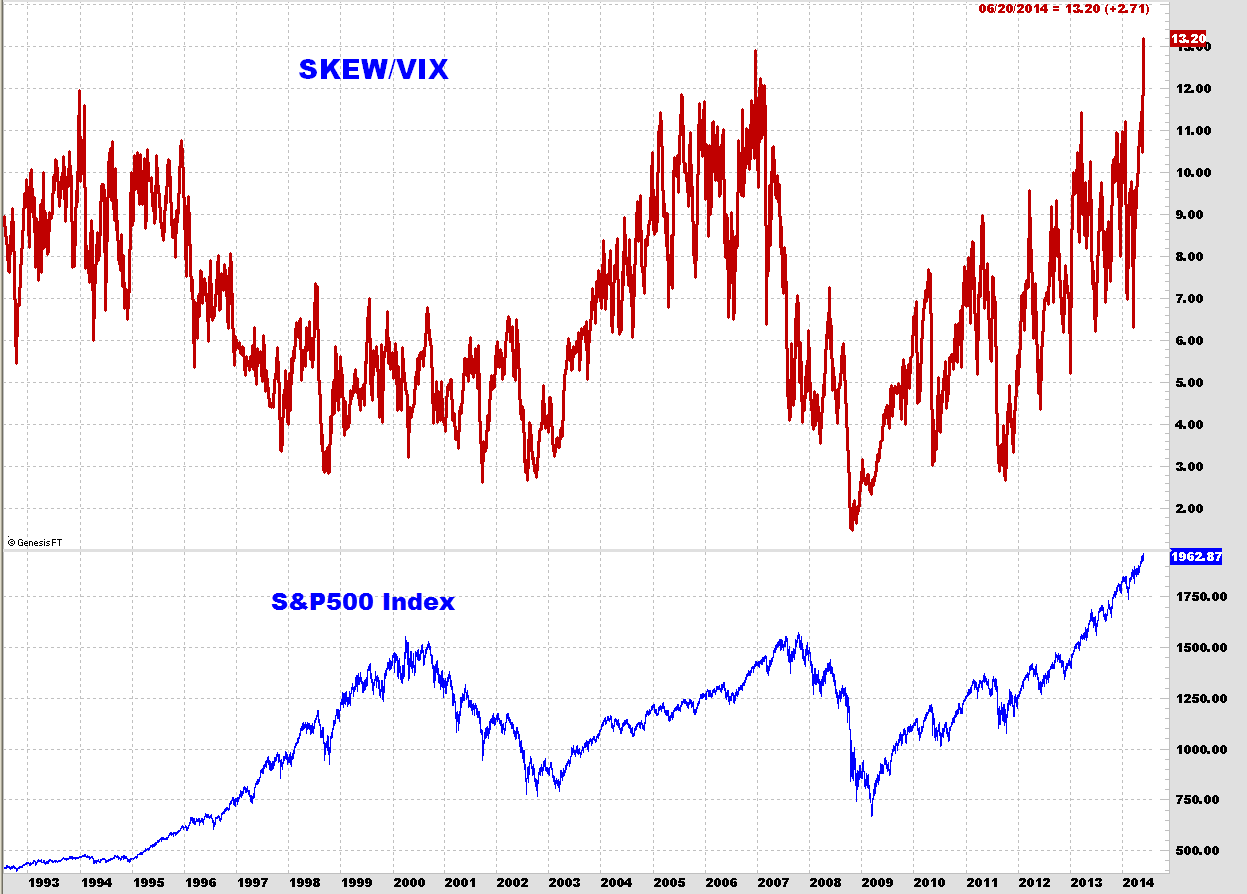
| I came across an interesting indicator lately which I had not seen before. It is the ratio of the CBOE SKEW index divided by the CBOE VIX index. The SKEW is described on the CBOE website as "an index derived from the price of S&P 500 tail risk calculated from the prices of S&P 500 out-of-the-money options." The higher the value of SKEW rising above 100, the greater the risk options traders see of outlier returns. Increases in SKEW correspond to the increase in perceived risk of rising volatility. In other words, it is the risk options traders see for a 'Black Swan event' in markets. According to the CBOE website, the VIX index "is a key measure of market expectations of near-term volatility conveyed by S&P 500 stock index option prices. Since its introduction in 1993, VIX has been considered by many to be the world's premier barometer of investor sentiment and market volatility." Many call it the 'fear index' because it rises when investors believe the risk of falling prices is on the rise. |
|
| Figure 1 � Long-term chart of the SKEW divided by the VIX (red) showing what has happened after multi-year highs in the ratio to the S&P 500 index (blue) � with the exception of the year 2000. |
| Graphic provided by: Trade Navigator by http://www.tradenavigator.com/. |
| |
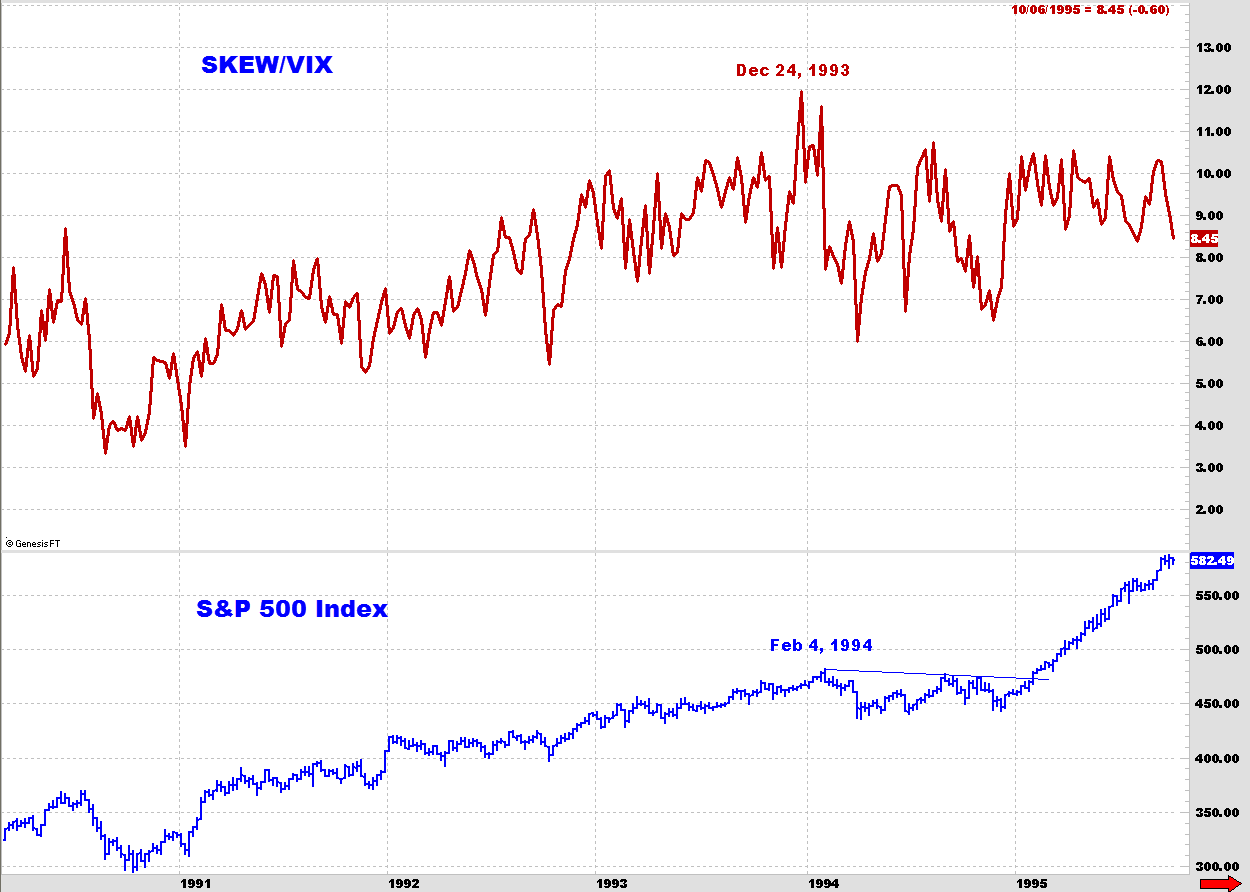
| What is interesting is that even though you might assume that both would rise about the same time, the opposite appears to be the case near market tops. Unfortunately, SKEW index data goes back just 20 years making a long-term statistically significant comparison of peaks in the SKEW/VIX indicator with market tops impossible. But as we see in Figure 1 and Figure 2, it has worked reasonably well since its inception — with one glaring exception. The SKEW/VIX first peaked on December 24, 1993 (Figure 2) about six weeks before the SPX peaked, after which stock prices performed poorly over the next 12 months — not a major Black Swan event but the indicator did accurately warn of a medium-term correction. At the next market peak in 2000, the indicator was well off its previous peak in 1993 so no warning then which means that any trader watching the indicator would probably have missed the significance of the next SKEW/VIX peak on December 16, 2006. |
|
| Figure 2. First indicator peak not long after the inception of the SKEW index showing what happened to the SPX not long afterward. |
| Graphic provided by: Trade Navigator by http://www.tradenavigator.com/. |
| |
| The chart in Figure 3 shows what happened prior to the beginning of the financial crisis in 2007 with the SKEW/VIX indicator peaking 10 months before the SPX. |

|
| Figure 3 � Close up of the period between 2005 and 2009 showing the peak in the red line that preceded the peak in the SPX by nearly 10 months. |
| Graphic provided by: Trade Navigator by http://www.tradenavigator.com/. |
| |
| In looking back at Figure 1, note that the SKEW/VIX hit a new all-time high in the third week of June 2014 surpassing the previous high on December 16, 2006. Given the past history of the indicator, this signal could not be considered statistically significant. However, when taken together with the recent peaks in other indicators including corporate profits to GDP, Warren's favorite valuation measure of US market cap to GDP and NYSE margin debt which peaked in February (see "Warren's Best Valuation Measure And Other Charts Updated"), the recent peak in the SKEW/VIX ratio becomes even more interesting. |
| SUGGESTED READING: CBOE SKEW Index Description CBOE VIX Index Description |
Matt Blackman is a full-time technical and financial writer and trader. He produces corporate and financial newsletters, and assists clients in getting published in the mainstream media. He is the host of TradeSystemGuru.com. Matt has earned the Chartered Market Technician (CMT) designation. Find out what stocks and futures Matt is watching on Twitter at www.twitter.com/RatioTrade
| Company: | TradeSystemGuru.com |
| Address: | Box 2589 |
| Garibaldi Highlands, BC Canada | |
| Phone # for sales: | 604-898-9069 |
| Fax: | 604-898-9069 |
| Website: | www.tradesystemguru.com |
| E-mail address: | indextradermb@gmail.com |
Traders' Resource Links | |
| TradeSystemGuru.com has not added any product or service information to TRADERS' RESOURCE. | |
Click here for more information about our publications!
Comments

Request Information From Our Sponsors
- StockCharts.com, Inc.
- Candle Patterns
- Candlestick Charting Explained
- Intermarket Technical Analysis
- John Murphy on Chart Analysis
- John Murphy's Chart Pattern Recognition
- John Murphy's Market Message
- MurphyExplainsMarketAnalysis-Intermarket Analysis
- MurphyExplainsMarketAnalysis-Visual Analysis
- StockCharts.com
- Technical Analysis of the Financial Markets
- The Visual Investor
- VectorVest, Inc.
- Executive Premier Workshop
- One-Day Options Course
- OptionsPro
- Retirement Income Workshop
- Sure-Fire Trading Systems (VectorVest, Inc.)
- Trading as a Business Workshop
- VectorVest 7 EOD
- VectorVest 7 RealTime/IntraDay
- VectorVest AutoTester
- VectorVest Educational Services
- VectorVest OnLine
- VectorVest Options Analyzer
- VectorVest ProGraphics v6.0
- VectorVest ProTrader 7
- VectorVest RealTime Derby Tool
- VectorVest Simulator
- VectorVest Variator
- VectorVest Watchdog