

HOT TOPICS LIST
- MACD
- Fibonacci
- RSI
- Gann
- ADXR
- Stochastics
- Volume
- Triangles
- Futures
- Cycles
- Volatility
- ZIGZAG
- MESA
- Retracement
- Aroon
INDICATORS LIST
LIST OF TOPICS
PRINT THIS ARTICLE
by Matt Blackman
As a market leader, what GOOG does has a major influence on stocks. Recent action suggests that the recent rally may be under threat.
Position: N/A
Matt Blackman
Matt Blackman is a full-time technical and financial writer and trader. He produces corporate and financial newsletters, and assists clients in getting published in the mainstream media. He is the host of TradeSystemGuru.com. Matt has earned the Chartered Market Technician (CMT) designation. Find out what stocks and futures Matt is watching on Twitter at www.twitter.com/RatioTrade
PRINT THIS ARTICLE
BULL/BEAR MARKET
Google Feeling The Heat
06/18/14 04:01:12 PMby Matt Blackman
As a market leader, what GOOG does has a major influence on stocks. Recent action suggests that the recent rally may be under threat.
Position: N/A
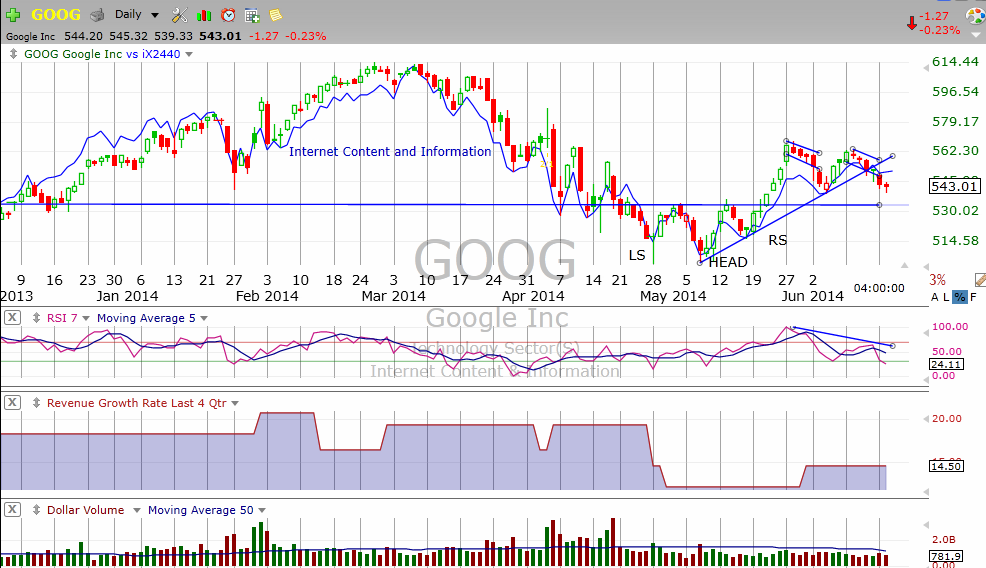
| In "Google - Another Bullish Reversal?" I discussed a bullish head & shoulders (H&S) reversal. The stock did reverse and moved above the minimum H&S upside target of $563 before beginning a series of downside moves including two failed bull flag patterns as the stock sank toward H&S neckline support (see Figure 1). It also broke its most recent uptrend support line on June 16, 2014. Does this mean the stock is in for more downside action ahead? |
|
| Figure 1 � Daily Chart Of Google (GOOG). Here you see the daily price chart of GOOG and its industry (blue line) showing the bullish head & shoulders (H&S) pattern, recent downside action including two failed bull flags, below average volume, and the down trending relative strength index (RSI). |
| Graphic provided by: TC2000.com. |
| |
| What is interesting is that throughout the bullish H&S reversal and downside action that followed, volume remained below its 50-day moving average which means that buyers and sellers have not jumped into the stock in large numbers. It's an important premise of technical analysis that while stocks need ever growing volume to sustain a rally, stock prices can fall "of their own weight" in a correction or bear market. |
|
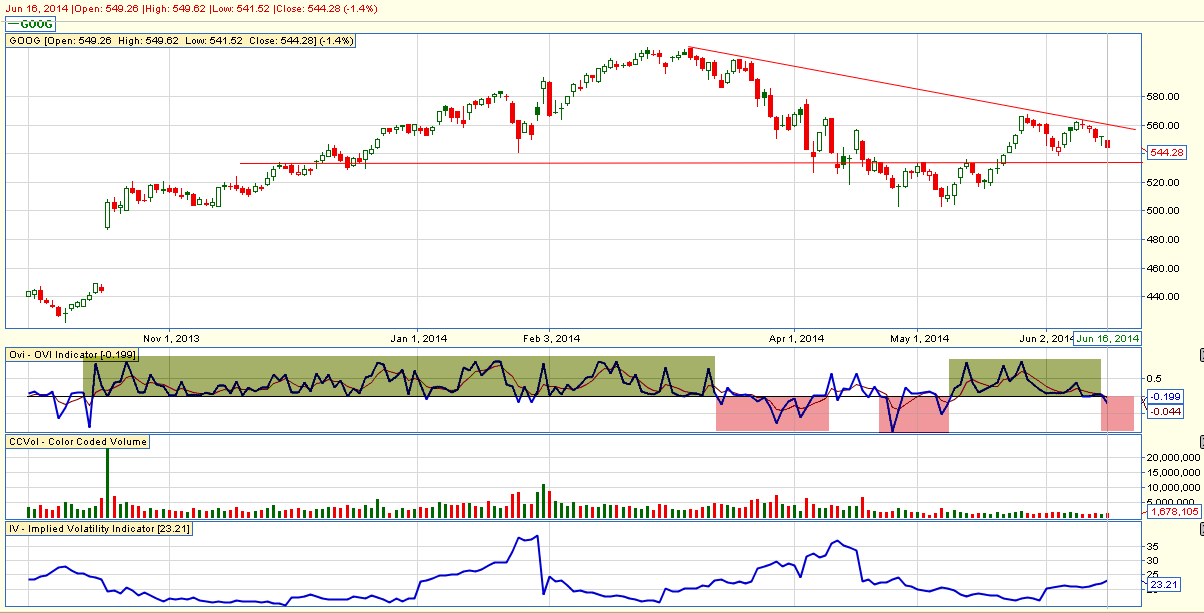
| Figure 2 � Daily chart of GOOG showing long-term support around $533 (horizontal red line) and how options traders have traded the stock since late 2013. When the OVI indicator has predominantly remained below the zero line (red) the stock has fallen and when the OVI has been above zero (green), the stock has risen. |
| Graphic provided by: www.ovitradersclub.com. |
| |
| It is also interesting to note that options traders turned bearish on June 16, 2014 for the first time since May 8, 2014 as evidenced by the OVI, a composite indicator that shows options positions. This indicator has proven to be valuable at anticipating stock direction when used in conjunction with powerful chart patterns. |
| The technical outlook for GOOG has changed from bullish to neutral. If support at $533 is broken and the OVI continues to sink into negative territory, this outlook will get more bearish. And if volume does increase on downside action, it will be a further bearish omen for the stock. |
Matt Blackman is a full-time technical and financial writer and trader. He produces corporate and financial newsletters, and assists clients in getting published in the mainstream media. He is the host of TradeSystemGuru.com. Matt has earned the Chartered Market Technician (CMT) designation. Find out what stocks and futures Matt is watching on Twitter at www.twitter.com/RatioTrade
| Company: | TradeSystemGuru.com |
| Address: | Box 2589 |
| Garibaldi Highlands, BC Canada | |
| Phone # for sales: | 604-898-9069 |
| Fax: | 604-898-9069 |
| Website: | www.tradesystemguru.com |
| E-mail address: | indextradermb@gmail.com |
Traders' Resource Links | |
| TradeSystemGuru.com has not added any product or service information to TRADERS' RESOURCE. | |
Click here for more information about our publications!
PRINT THIS ARTICLE

Request Information From Our Sponsors
- StockCharts.com, Inc.
- Candle Patterns
- Candlestick Charting Explained
- Intermarket Technical Analysis
- John Murphy on Chart Analysis
- John Murphy's Chart Pattern Recognition
- John Murphy's Market Message
- MurphyExplainsMarketAnalysis-Intermarket Analysis
- MurphyExplainsMarketAnalysis-Visual Analysis
- StockCharts.com
- Technical Analysis of the Financial Markets
- The Visual Investor
- VectorVest, Inc.
- Executive Premier Workshop
- One-Day Options Course
- OptionsPro
- Retirement Income Workshop
- Sure-Fire Trading Systems (VectorVest, Inc.)
- Trading as a Business Workshop
- VectorVest 7 EOD
- VectorVest 7 RealTime/IntraDay
- VectorVest AutoTester
- VectorVest Educational Services
- VectorVest OnLine
- VectorVest Options Analyzer
- VectorVest ProGraphics v6.0
- VectorVest ProTrader 7
- VectorVest RealTime Derby Tool
- VectorVest Simulator
- VectorVest Variator
- VectorVest Watchdog