

HOT TOPICS LIST
- MACD
- Fibonacci
- RSI
- Gann
- ADXR
- Stochastics
- Volume
- Triangles
- Futures
- Cycles
- Volatility
- ZIGZAG
- MESA
- Retracement
- Aroon
INDICATORS LIST
LIST OF TOPICS
PRINT THIS ARTICLE
by Matt Blackman
This is the second stock in recent days to post this pattern. What does it mean?
Position: N/A
Matt Blackman
Matt Blackman is a full-time technical and financial writer and trader. He produces corporate and financial newsletters, and assists clients in getting published in the mainstream media. He is the host of TradeSystemGuru.com. Matt has earned the Chartered Market Technician (CMT) designation. Find out what stocks and futures Matt is watching on Twitter at www.twitter.com/RatioTrade
PRINT THIS ARTICLE
BULL/BEAR MARKET
Google - Another Bullish Reversal?
05/28/14 03:53:31 PMby Matt Blackman
This is the second stock in recent days to post this pattern. What does it mean?
Position: N/A
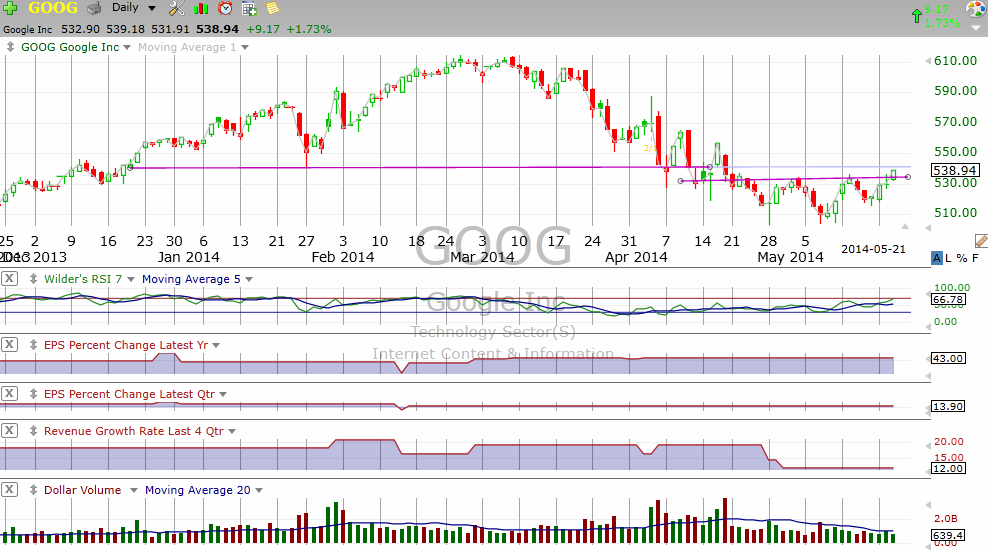
| Last week I noticed a bullish inverted head & shoulders (H&S) pattern on Netflix (NFLX) which appeared to invalidate a much larger bearish H&S pattern that appeared prior (see "NetFlix Sell Reversal - Is It Time To Buy Again?"). This pattern appeared on GOOG (non-voting shares) and GOOGL (Class A voting shares); the latter of which began trading after the April 3, 2014 stock split in which GOOG shares owners received one share of GOOG and one share of GOOGL. I include charts of GOOG here since it has more earnings history (Figure 1). |
|
| Figure 1. Daily chart of Google (GOOG) showing the latest H&S (inverted) pattern with upside breach of the neckline May 21, 2014. Note that revenues have been growing more slowly which could pose problems for the stock price down the road if the trend continues. |
| Graphic provided by: TC2000.com. |
| |
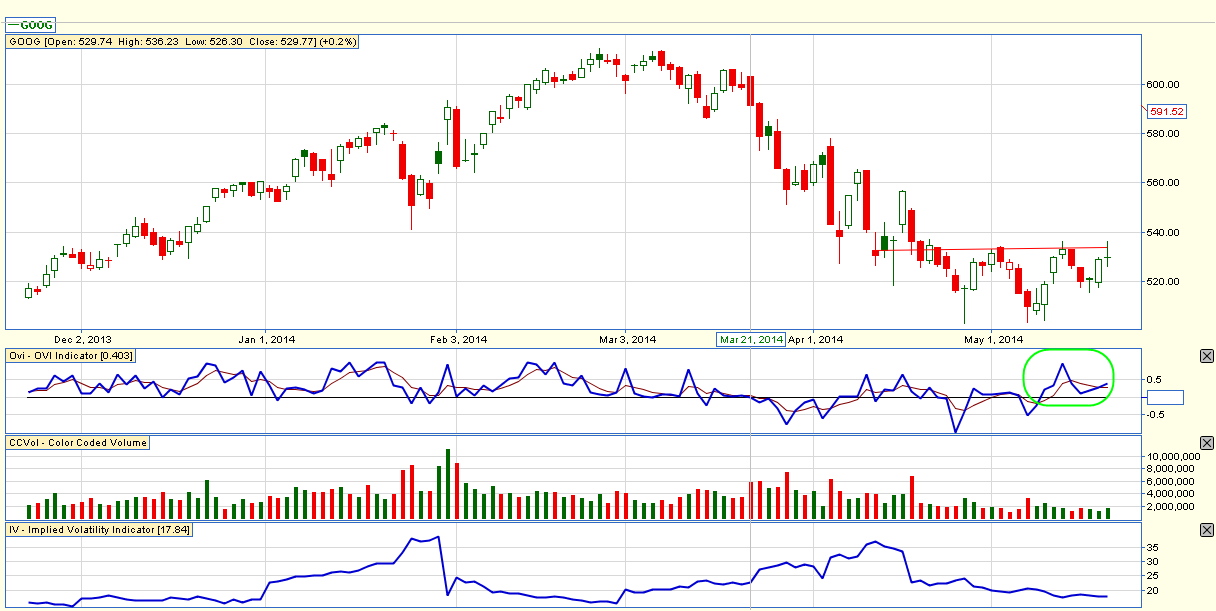
| Options activity has also been bullish on GOOG as you can see in the Options Volatility chart in Figure 2. Note that the OVI indicator, which shows a composite of options data for GOOG, popped into positive territory May 9, 2014 and is trending upwards. This shows that options traders are making increasingly bullish bets on GOOG. For a detailed explanation of how the OVI works, please refer to OVIIndex.com. |
|
| Figure 2. Daily chart of Google (GOOG) showing options activity for GOOG from FlagTraders.com. The OVI indicator moved into positive territory on May 9, 2014 together with the bullish inverted H&S chart pattern. |
| Graphic provided by: http://www.privatetradersclub.com. |
| |
| That market leaders like GOOG and NFLX are flashing bullish chart patterns is good news for the bulls, at least in the short-term. One major caveat is that the market has been acting bearishly over the last few weeks. But these patterns provide shorter-term traders with ways to make money on the long side as long as these trends continue and the market leaders are rallying. |
Matt Blackman is a full-time technical and financial writer and trader. He produces corporate and financial newsletters, and assists clients in getting published in the mainstream media. He is the host of TradeSystemGuru.com. Matt has earned the Chartered Market Technician (CMT) designation. Find out what stocks and futures Matt is watching on Twitter at www.twitter.com/RatioTrade
| Company: | TradeSystemGuru.com |
| Address: | Box 2589 |
| Garibaldi Highlands, BC Canada | |
| Phone # for sales: | 604-898-9069 |
| Fax: | 604-898-9069 |
| Website: | www.tradesystemguru.com |
| E-mail address: | indextradermb@gmail.com |
Traders' Resource Links | |
| TradeSystemGuru.com has not added any product or service information to TRADERS' RESOURCE. | |
Click here for more information about our publications!
PRINT THIS ARTICLE

Request Information From Our Sponsors
- StockCharts.com, Inc.
- Candle Patterns
- Candlestick Charting Explained
- Intermarket Technical Analysis
- John Murphy on Chart Analysis
- John Murphy's Chart Pattern Recognition
- John Murphy's Market Message
- MurphyExplainsMarketAnalysis-Intermarket Analysis
- MurphyExplainsMarketAnalysis-Visual Analysis
- StockCharts.com
- Technical Analysis of the Financial Markets
- The Visual Investor
- VectorVest, Inc.
- Executive Premier Workshop
- One-Day Options Course
- OptionsPro
- Retirement Income Workshop
- Sure-Fire Trading Systems (VectorVest, Inc.)
- Trading as a Business Workshop
- VectorVest 7 EOD
- VectorVest 7 RealTime/IntraDay
- VectorVest AutoTester
- VectorVest Educational Services
- VectorVest OnLine
- VectorVest Options Analyzer
- VectorVest ProGraphics v6.0
- VectorVest ProTrader 7
- VectorVest RealTime Derby Tool
- VectorVest Simulator
- VectorVest Variator
- VectorVest Watchdog