

HOT TOPICS LIST
- MACD
- Fibonacci
- RSI
- Gann
- ADXR
- Stochastics
- Volume
- Triangles
- Futures
- Cycles
- Volatility
- ZIGZAG
- MESA
- Retracement
- Aroon
INDICATORS LIST
LIST OF TOPICS
PRINT THIS ARTICLE
by Matt Blackman
In early May, NFLX was looking like it was about to put in a bearish reversal. Now, not so much.
Position: N/A
Matt Blackman
Matt Blackman is a full-time technical and financial writer and trader. He produces corporate and financial newsletters, and assists clients in getting published in the mainstream media. He is the host of TradeSystemGuru.com. Matt has earned the Chartered Market Technician (CMT) designation. Find out what stocks and futures Matt is watching on Twitter at www.twitter.com/RatioTrade
PRINT THIS ARTICLE
HEAD & SHOULDERS
NetFlix Sell Reversal - Is It Time to Buy Again?
05/23/14 03:04:50 PMby Matt Blackman
In early May, NFLX was looking like it was about to put in a bearish reversal. Now, not so much.
Position: N/A
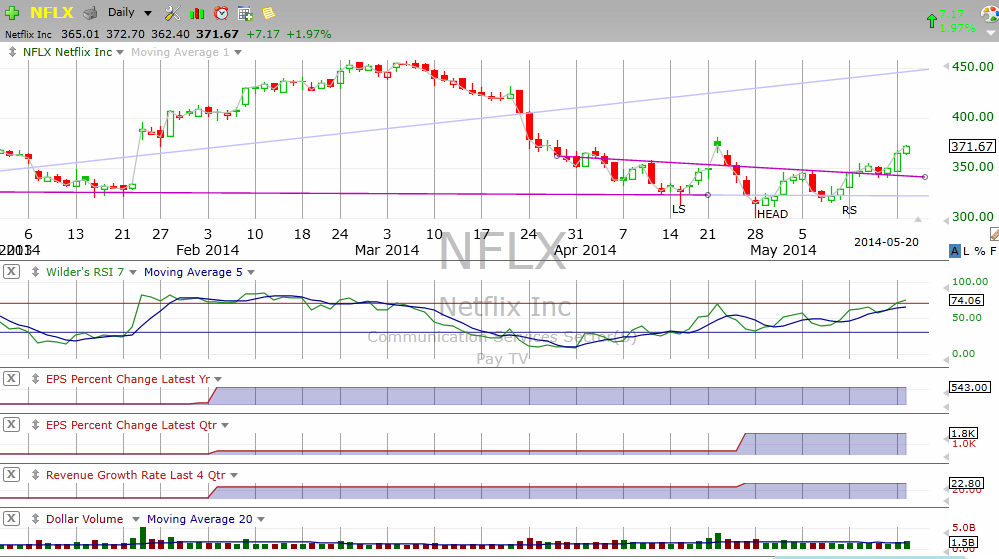
| In my article "Netflix - Negative Reaction To Positive Earnings A Bad Sign" I discussed the bearish head & shoulders pattern on the stock that together with the negative reaction to relatively good earnings meant that stock was encountering some serious headwinds. As it turns out, the head & shoulders pattern looks, at least for the time being, to have been invalidated after a brief but indecisive breach of the neckline followed by a swift bullish reversal. |
|
| Figure 1 � Daily chart showing the recent NFLX inverse head & shoulders pattern which suggests a minimum upside price target of $390. |
| Graphic provided by: TC2000.com. |
| |
| Now as we see from Figure 1, the stock has just confirmed a small but interesting inverted head & shoulders pattern and after a brief successful test of neckline support, has moved higher again. Although there exists the possibility that the recent uptrend could end up building a larger right shoulder in the prior bearish H&S pattern, we must also look at the distinct possibility that NFLX is off and running to make another attempt to surpass its early March peak near $450. The latest H&S pattern suggests a minimum price target of $390 which would also be an interesting right shoulder peak if the bears do continue to take control of this market. |
|
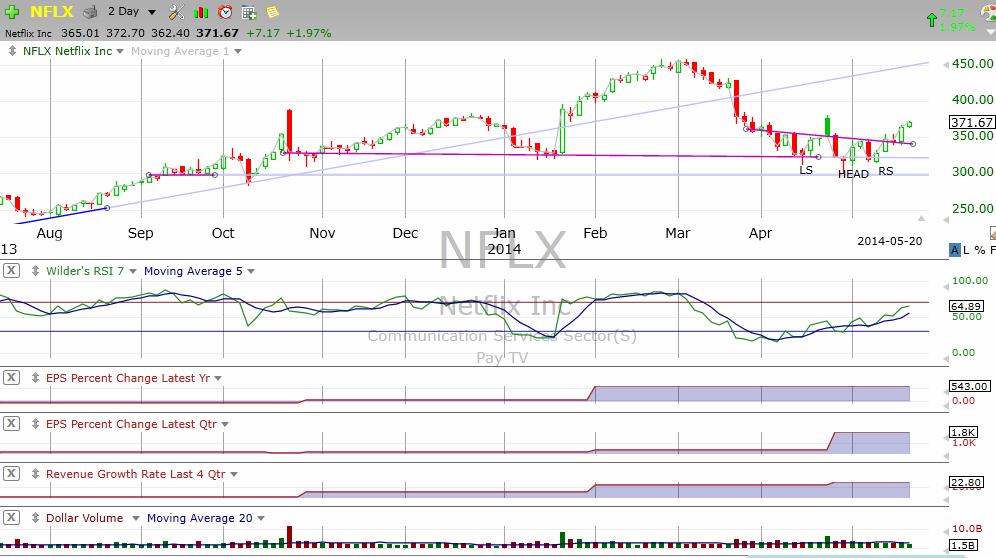
| Figure 2 � Two day chart of NetFlix showing the longer-term pattern and building positive RSI divergence before the inverse H&S pattern was confirmed. |
| Graphic provided by: TC2000.com. |
| |
| In Figure 2 we see the longer term chart showing the bearish head & shoulders pattern with neckline around $322. This chart confirms that NFLX is not out of the woods yet with the possibility that this rally will peter out once a right shoulder has formed. But in trader terms, that is a long-term prediction. Given the most recent action, there is a chance to make a profitable long trade while we wait. |
|
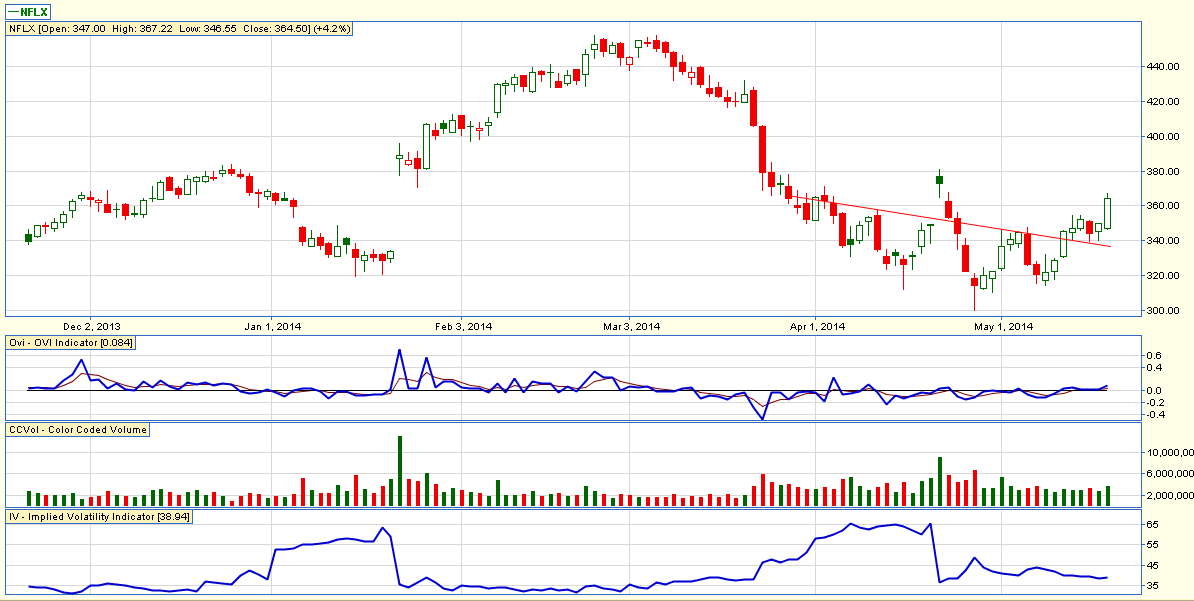
| Figure 3 � Daily chart of NetFlix showing the options OVI indicator in the upper-mid sub-graph with options implied volatility in the lower sub-graph. |
| Graphic provided by: http://www.privatetradersclub.com/. |
| |
| Bullishness in the short-term is further confirmed by the recent upside break out of the OVI indicator in Figure 3 showing that options traders are getting more bullish on the stock with the indicator remaining in positive territory since the head & shoulders neckline breakout occurred May 12, 2014. For a detailed outline of how the OVI indicator works, please see OVIIndex.com. |
| As a long-term market leader, the fact that NFLX is rising even as the overall market struggles is a positive sign, as long as it continues. If this is a broad recovery in the making, leaders like NFLX will be the early starters helping to pull other stocks higher. |
Matt Blackman is a full-time technical and financial writer and trader. He produces corporate and financial newsletters, and assists clients in getting published in the mainstream media. He is the host of TradeSystemGuru.com. Matt has earned the Chartered Market Technician (CMT) designation. Find out what stocks and futures Matt is watching on Twitter at www.twitter.com/RatioTrade
| Company: | TradeSystemGuru.com |
| Address: | Box 2589 |
| Garibaldi Highlands, BC Canada | |
| Phone # for sales: | 604-898-9069 |
| Fax: | 604-898-9069 |
| Website: | www.tradesystemguru.com |
| E-mail address: | indextradermb@gmail.com |
Traders' Resource Links | |
| TradeSystemGuru.com has not added any product or service information to TRADERS' RESOURCE. | |
Click here for more information about our publications!
Comments
Date:�06/02/14Rank:�5Comment:�

Request Information From Our Sponsors
- StockCharts.com, Inc.
- Candle Patterns
- Candlestick Charting Explained
- Intermarket Technical Analysis
- John Murphy on Chart Analysis
- John Murphy's Chart Pattern Recognition
- John Murphy's Market Message
- MurphyExplainsMarketAnalysis-Intermarket Analysis
- MurphyExplainsMarketAnalysis-Visual Analysis
- StockCharts.com
- Technical Analysis of the Financial Markets
- The Visual Investor
- VectorVest, Inc.
- Executive Premier Workshop
- One-Day Options Course
- OptionsPro
- Retirement Income Workshop
- Sure-Fire Trading Systems (VectorVest, Inc.)
- Trading as a Business Workshop
- VectorVest 7 EOD
- VectorVest 7 RealTime/IntraDay
- VectorVest AutoTester
- VectorVest Educational Services
- VectorVest OnLine
- VectorVest Options Analyzer
- VectorVest ProGraphics v6.0
- VectorVest ProTrader 7
- VectorVest RealTime Derby Tool
- VectorVest Simulator
- VectorVest Variator
- VectorVest Watchdog