HOT TOPICS LIST
- MACD
- Fibonacci
- RSI
- Gann
- ADXR
- Stochastics
- Volume
- Triangles
- Futures
- Cycles
- Volatility
- ZIGZAG
- MESA
- Retracement
- Aroon
INDICATORS LIST
LIST OF TOPICS
PRINT THIS ARTICLE
by Matt Blackman
Since peaking in September 2012, Apple has been working to mount a comeback. But the stock chart is facing some challenges.
Position: N/A
Matt Blackman
Matt Blackman is a full-time technical and financial writer and trader. He produces corporate and financial newsletters, and assists clients in getting published in the mainstream media. He is the host of TradeSystemGuru.com. Matt has earned the Chartered Market Technician (CMT) designation. Find out what stocks and futures Matt is watching on Twitter at www.twitter.com/RatioTrade
PRINT THIS ARTICLE
BULL/BEAR MARKET
Apple - Looking Technically Strong But...
06/05/14 01:47:30 PMby Matt Blackman
Since peaking in September 2012, Apple has been working to mount a comeback. But the stock chart is facing some challenges.
Position: N/A
| My March 2013 article "What's Up with Apple?", when the stock was trading at $428, looked at the bearish head & shoulders (H&S) pattern that had been confirmed with a projected pattern target of around $360. As it turned out, that was a tad bearish — the stock bottomed in April at $385. Since then the stock has slowly but surely rallied north of $630 by the end of May 2014. Those who bought near the bottom have done quite well in the intervening year but what can they expect going forward? |

|
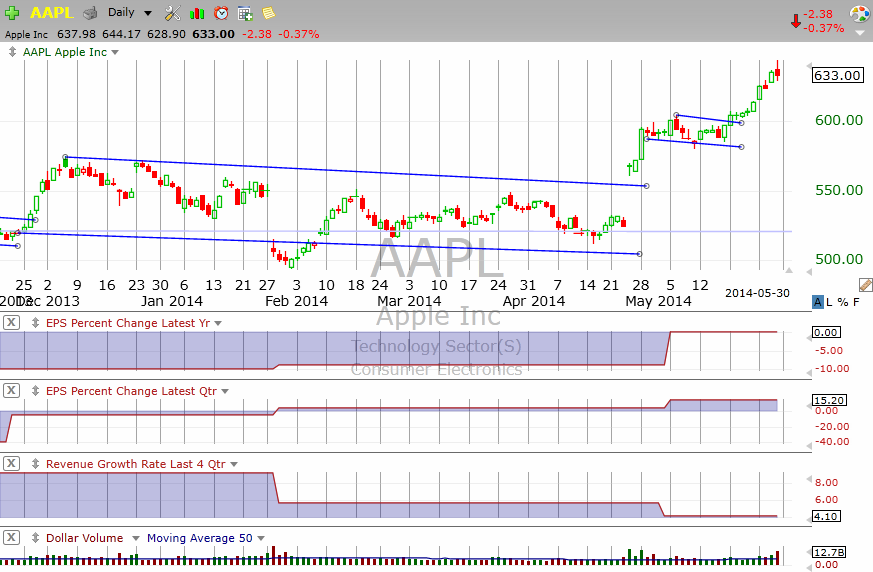
| Figure 1 – Daily chart of AAPL showing the extended consolidation channel between December 2013 and April 2014 followed by a strong breakout with an intervening bear flag about mid-way. |
| Graphic provided by: TC2000.com. |
| |
| The stock spent the six month period beginning in December 2013 in a rough-shod consolidation pattern but then gapped up in late April 2014 to rally north of $600 in May. But there are some signs that the rally may experience some headwinds from here. As we saw in Figure 1 of "What's Up With Apple?," July through mid-September has typically been a good time for the stock over its 20+ year stock history and the company did unusually well this Spring. |

|
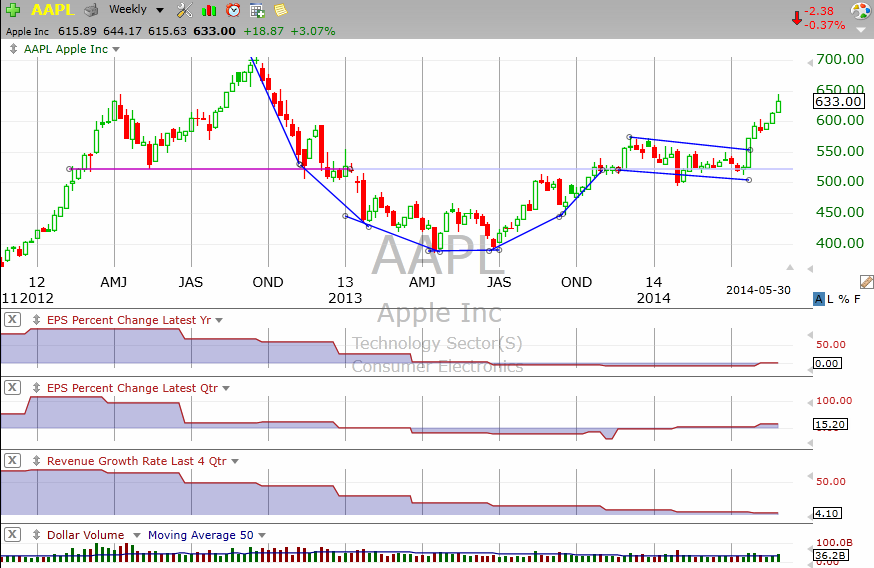
| Figure 2 – Weekly chart of AAPL showing the bullish cup & handle pattern juxtaposed by the steadily declining earnings and revenues. |
| Graphic provided by: TC2000.com. |
| |
| So what's the problem now? You can see the cup & handle pattern (C&H) pattern on the weekly chart of AAPL in Figure 2. But take a closer look at earnings per share (EPS) and revenue growth in the lower subgraphs. Both show a slow but steady decline over the last two years with the former showing a rather unimpressive growth rate of 0% as of the latest data. Revenues were growing at a paltry rate of just 4.1% — paltry because revenues were growing at more than 70% and EPS at more than 100% just 26 months before. |

|
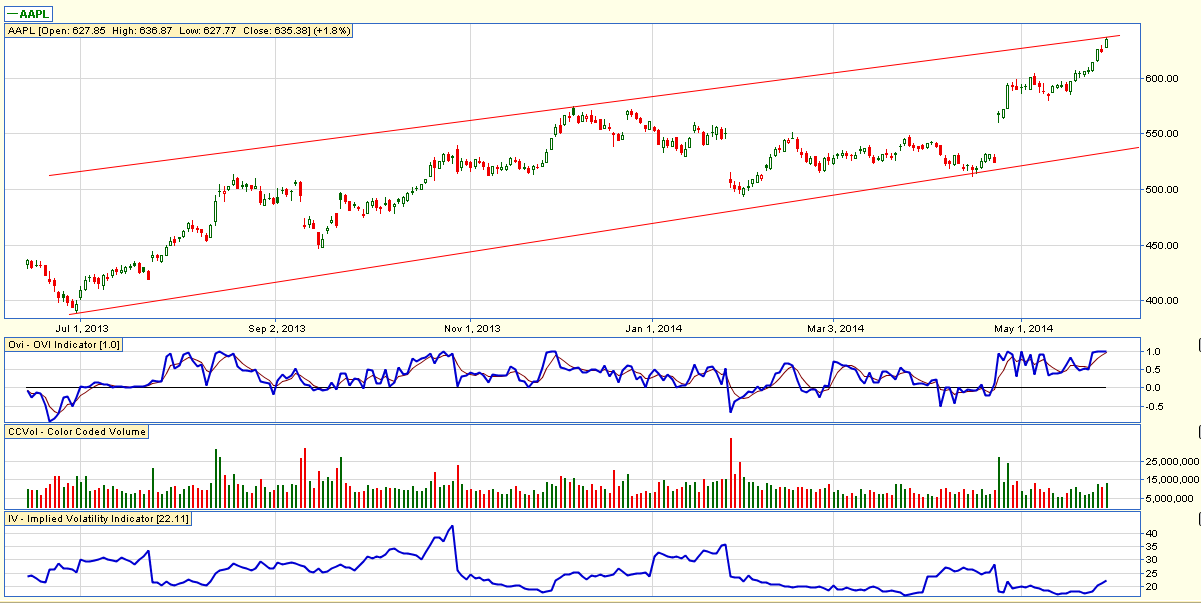
| Figure 3 – Daily chart of Apple showing the clear trading channel from July 2013 and bullish options activity as shown by the OVI reading well above zero (middle subgraph). For a more detailed explanation of this indicator please see http://oviindex.com/ |
| Graphic provided by: http://www.ovitradersclub.com/. |
| |
| It is interesting to note that the C&H pattern in Figure 2 put in the handle just half-way up the pattern which is decidedly bearish — it is far more bullish to have the handle form near the rim of the cup and then break out higher from there. In Figure 3 you see the trading channel on the stock with the price trading right at the top channel line. It is also worth mentioning that the seven-period Wilder's RSI was trading above 82 on May 30 which puts the stock in overbought territory (not shown). |
| From a technical standpoint, AAPL is in an uptrend but the C&H pattern has already generated a handle breakout buy signal and now offers traders little insight into where the stock may be headed other than it can expect major resistance as it approaches its previous high around $700. The planned 7-for-1 stock split on June 2, 2014 which will begin trading at the new price June 6, 2014 will be short-term bullish but it's hard to say how much of that is already baked into the price. According to the company's investor relation page, this will be its fourth stock split — prior splits occurred on May 15, 1987, June 21, 2000 and February 18, 2005 (2-for-1). But unless there is some good news on the revenue and earnings front for Apple going forward, traders should expect the stock to experience increased headwinds post split and into year-end 2014. |
Matt Blackman is a full-time technical and financial writer and trader. He produces corporate and financial newsletters, and assists clients in getting published in the mainstream media. He is the host of TradeSystemGuru.com. Matt has earned the Chartered Market Technician (CMT) designation. Find out what stocks and futures Matt is watching on Twitter at www.twitter.com/RatioTrade
| Company: | TradeSystemGuru.com |
| Address: | Box 2589 |
| Garibaldi Highlands, BC Canada | |
| Phone # for sales: | 604-898-9069 |
| Fax: | 604-898-9069 |
| Website: | www.tradesystemguru.com |
| E-mail address: | indextradermb@gmail.com |
Traders' Resource Links | |
| TradeSystemGuru.com has not added any product or service information to TRADERS' RESOURCE. | |
Click here for more information about our publications!
PRINT THIS ARTICLE

Request Information From Our Sponsors
- StockCharts.com, Inc.
- Candle Patterns
- Candlestick Charting Explained
- Intermarket Technical Analysis
- John Murphy on Chart Analysis
- John Murphy's Chart Pattern Recognition
- John Murphy's Market Message
- MurphyExplainsMarketAnalysis-Intermarket Analysis
- MurphyExplainsMarketAnalysis-Visual Analysis
- StockCharts.com
- Technical Analysis of the Financial Markets
- The Visual Investor
- VectorVest, Inc.
- Executive Premier Workshop
- One-Day Options Course
- OptionsPro
- Retirement Income Workshop
- Sure-Fire Trading Systems (VectorVest, Inc.)
- Trading as a Business Workshop
- VectorVest 7 EOD
- VectorVest 7 RealTime/IntraDay
- VectorVest AutoTester
- VectorVest Educational Services
- VectorVest OnLine
- VectorVest Options Analyzer
- VectorVest ProGraphics v6.0
- VectorVest ProTrader 7
- VectorVest RealTime Derby Tool
- VectorVest Simulator
- VectorVest Variator
- VectorVest Watchdog
