

HOT TOPICS LIST
- MACD
- Fibonacci
- RSI
- Gann
- ADXR
- Stochastics
- Volume
- Triangles
- Futures
- Cycles
- Volatility
- ZIGZAG
- MESA
- Retracement
- Aroon
INDICATORS LIST
LIST OF TOPICS
PRINT THIS ARTICLE
by Matt Blackman
AAPL stock looked like it was ready to bottom in early March 2013, but then the picture changed. So what's next for this troubled tech?
Position: N/A
Matt Blackman
Matt Blackman is a full-time technical and financial writer and trader. He produces corporate and financial newsletters, and assists clients in getting published in the mainstream media. He is the host of TradeSystemGuru.com. Matt has earned the Chartered Market Technician (CMT) designation. Find out what stocks and futures Matt is watching on Twitter at www.twitter.com/RatioTrade
PRINT THIS ARTICLE
FLAGS AND PENNANTS
What's Up With Apple?
03/15/13 01:52:29 PMby Matt Blackman
AAPL stock looked like it was ready to bottom in early March 2013, but then the picture changed. So what's next for this troubled tech?
Position: N/A
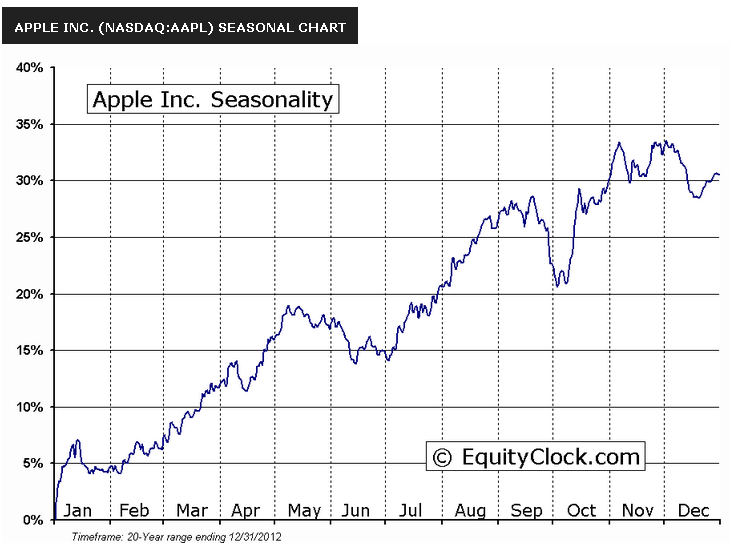
| Over the last twenty years, Q1 and Q3 have been a very good times to be invested in Apple Inc (see Figure 1). But in late 2012 that all changed. Between the first trading day of January to mid-March 2013, Apple stock dropped more than 22% - in a period that has historically been good for a 10% gain. Clearly, something has fundamentally changed for the company. But the big question is how much worse can it get? |
|
| Figure 1 � Composite seasonal chart for Apple over the last 20 years showing periods of strength and weakness. |
| Graphic provided by: EquityClock.com. |
| |
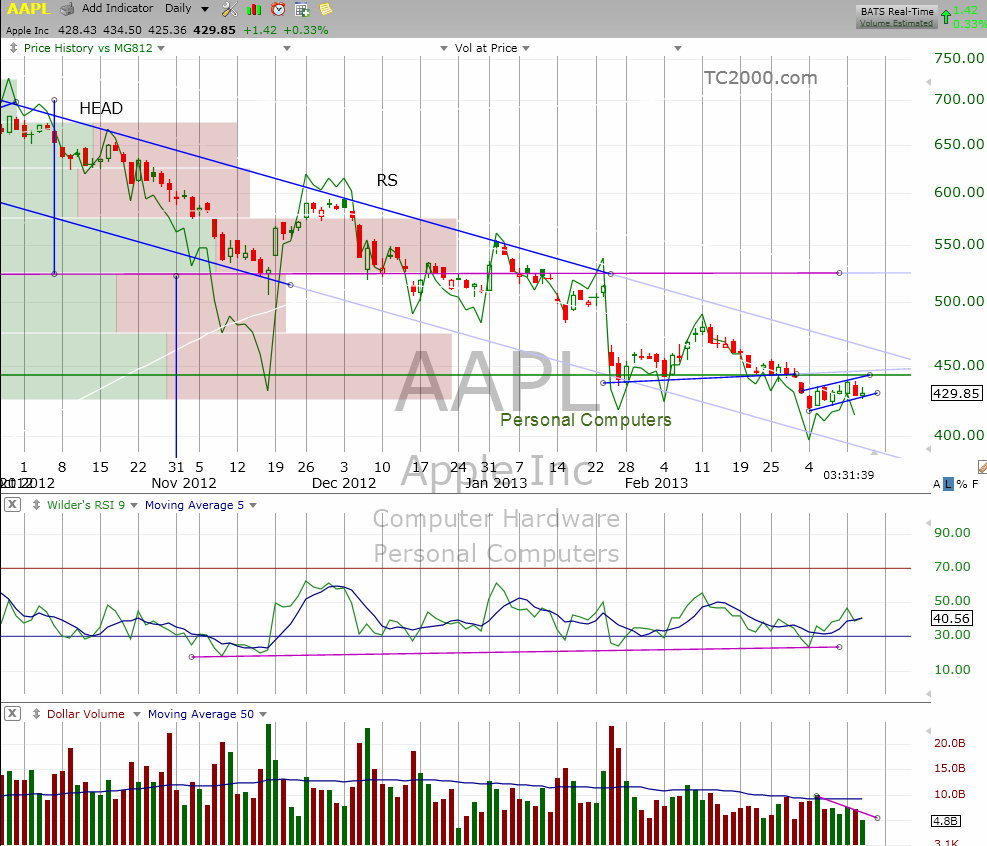
| One big problem with Apple is that until the launch of Android smart phones and tablets, Apple dominated the space in a big way. Samsung is clearly starting to eat Apple's lunch in those areas and one reason is the free Android operating system and applications, many of which are also free. This is not the case with the Apple IOS and many Apple apps. Not only have iPhone sales been impacted, profit margins in their most popular products, namely the iPhone 5 and the mini-iPad are shrinking versus earlier versions. The second big problem for Apple is the personal computer industry. As we see in Figure 2 and Figure 3 by the direction of the personal computer industry (green), Apple has been impacted by fading personal computer sales. And the trend for this industry in the near future at least, doesn't look great. Technically speaking, AAPL stock had many, including yours truly, believing that a bottom might be at hand in March 2013. But that pattern began to morph into a bear flag in the second week of March, a view supported by the volume profile (see purple volume trendline in Figure 2). |
|
| Figure 2 � Daily chart of AAPL with the Personal Computer industry (green line) showing the correlation between the two and the bear flag that was building in March supported by falling volume over the pattern. |
| Graphic provided by: TC2000.com. |
| |
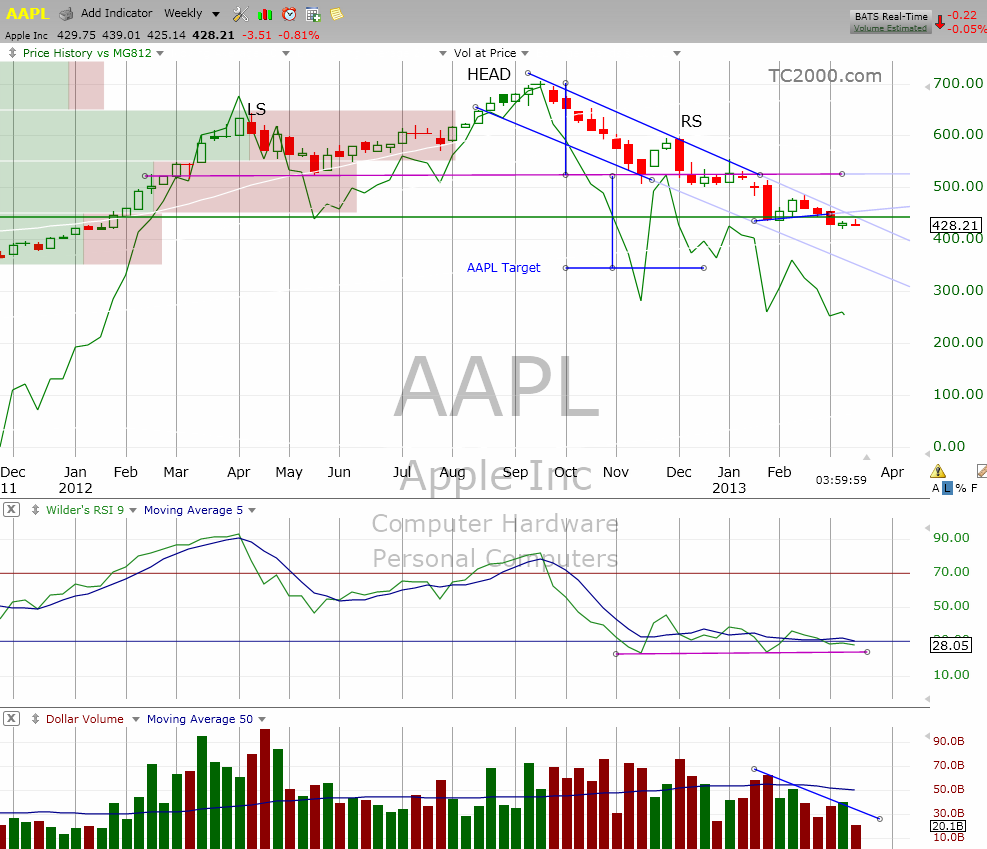
| Looking at the bigger picture (Figure 3), AAPL continues to follow the head and shoulders pattern with a projected target of $360, which for many pundits seems unlikely given the bullish sentiment in U.S. stocks these days. But let's not forget that in the last six months overall market strength has done nothing to help AAPL stock, which has fallen more than 35% as the Nasdaq Composite gained more than 2%. It's important to point out that between its peak in September 2012 and February 2013, AAPL posted no less than five bear flag patterns which all resolved to the downside. The latest flag is #6. On the weekly chart, there is major support around $420 and $400, then $365 just above the head and shoulders target. |
|
| Figure 3 � Weekly chart of AAPL and the Personal Computer industry (in green) showing the AAPL H&S pattern target. |
| Graphic provided by: TC2000.com. |
| |
| In mid-March 2013, AAPL was trading where it was in February 2012 and in what may seem like a distant memory now, at the beginning of this bull market in March 2009, the stock was trading in the $80s. That may seem like a long way down from here but stranger things have happened. In the meantime, the head and shoulders target around $360 just got a whole lot closer. |
Matt Blackman is a full-time technical and financial writer and trader. He produces corporate and financial newsletters, and assists clients in getting published in the mainstream media. He is the host of TradeSystemGuru.com. Matt has earned the Chartered Market Technician (CMT) designation. Find out what stocks and futures Matt is watching on Twitter at www.twitter.com/RatioTrade
| Company: | TradeSystemGuru.com |
| Address: | Box 2589 |
| Garibaldi Highlands, BC Canada | |
| Phone # for sales: | 604-898-9069 |
| Fax: | 604-898-9069 |
| Website: | www.tradesystemguru.com |
| E-mail address: | indextradermb@gmail.com |
Traders' Resource Links | |
| TradeSystemGuru.com has not added any product or service information to TRADERS' RESOURCE. | |
Click here for more information about our publications!
PRINT THIS ARTICLE

Request Information From Our Sponsors
- VectorVest, Inc.
- Executive Premier Workshop
- One-Day Options Course
- OptionsPro
- Retirement Income Workshop
- Sure-Fire Trading Systems (VectorVest, Inc.)
- Trading as a Business Workshop
- VectorVest 7 EOD
- VectorVest 7 RealTime/IntraDay
- VectorVest AutoTester
- VectorVest Educational Services
- VectorVest OnLine
- VectorVest Options Analyzer
- VectorVest ProGraphics v6.0
- VectorVest ProTrader 7
- VectorVest RealTime Derby Tool
- VectorVest Simulator
- VectorVest Variator
- VectorVest Watchdog
- StockCharts.com, Inc.
- Candle Patterns
- Candlestick Charting Explained
- Intermarket Technical Analysis
- John Murphy on Chart Analysis
- John Murphy's Chart Pattern Recognition
- John Murphy's Market Message
- MurphyExplainsMarketAnalysis-Intermarket Analysis
- MurphyExplainsMarketAnalysis-Visual Analysis
- StockCharts.com
- Technical Analysis of the Financial Markets
- The Visual Investor