

HOT TOPICS LIST
- MACD
- Fibonacci
- RSI
- Gann
- ADXR
- Stochastics
- Volume
- Triangles
- Futures
- Cycles
- Volatility
- ZIGZAG
- MESA
- Retracement
- Aroon
INDICATORS LIST
LIST OF TOPICS
PRINT THIS ARTICLE
by Matt Blackman
A major stock reversal is often presaged by negative divergences in important supporting sectors. Here are three that are sending warning signals.
Position: N/A
Matt Blackman
Matt Blackman is a full-time technical and financial writer and trader. He produces corporate and financial newsletters, and assists clients in getting published in the mainstream media. He is the host of TradeSystemGuru.com. Matt has earned the Chartered Market Technician (CMT) designation. Find out what stocks and futures Matt is watching on Twitter at www.twitter.com/RatioTrade
PRINT THIS ARTICLE
DIVERGENCE INDEX
Key Sectors Are Flashing Warnings
04/17/14 05:40:59 PMby Matt Blackman
A major stock reversal is often presaged by negative divergences in important supporting sectors. Here are three that are sending warning signals.
Position: N/A
| In a sustainable stock rally, strength comes from some key sectors and by far the biggest pillar supporting the latest rally has been furnished courtesy of Quantitative Easing programs by the Federal Reserve. Its goal was to spur investment and growth by pumping trillions into the US economy and keeping interest rates near zero. Although gains in the overall economy, especially jobs growth, have been harder to quantify, stocks have been a huge beneficiary, especially those in interest rate-sensitive areas like housing, financials, and consumer spending. But as we see in the charts in Figure 1, Figure 2, and Figure 3, they are all showing signs of stress. |
|
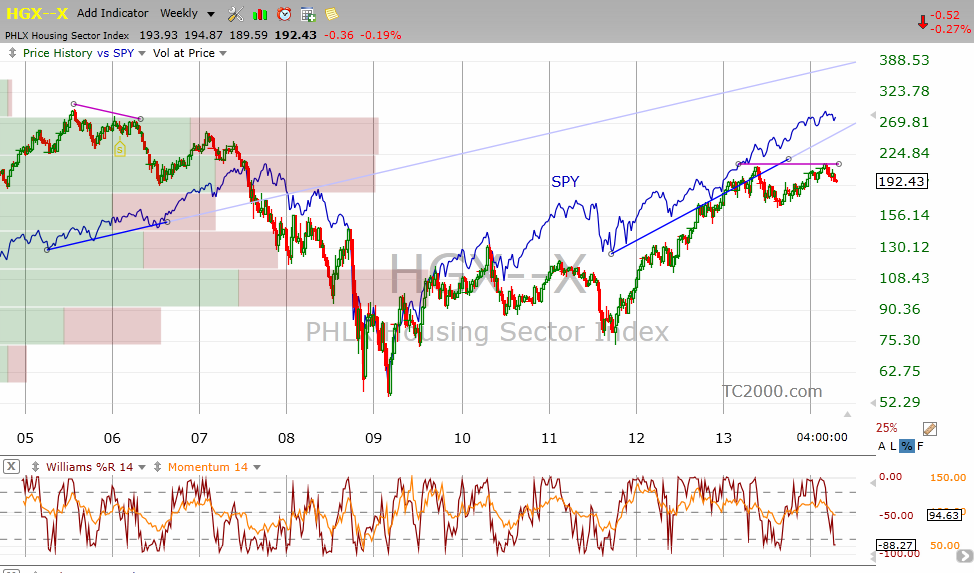
| Figure 1. Weekly chart of the PHLX Housing Sector Index (HGX) showing the negative divergences that has begun to emerge with the SPDR S&P 500 ETF Trust SPY. The same divergence began to appear in 2005-2006 nearly two years before the market came unglued. |
| Graphic provided by: TC2000.com. |
| |
| Low interest rates have helped the home builders and related industries since 2009 but that impact now appears to be waning. Figure 1 shows the negative divergence between the PHLX Housing Sector Index and the SPY even though the 30-year fixed mortgage rate remains near historic lows around 4.3% and has been trending lower since September 2013. |
|
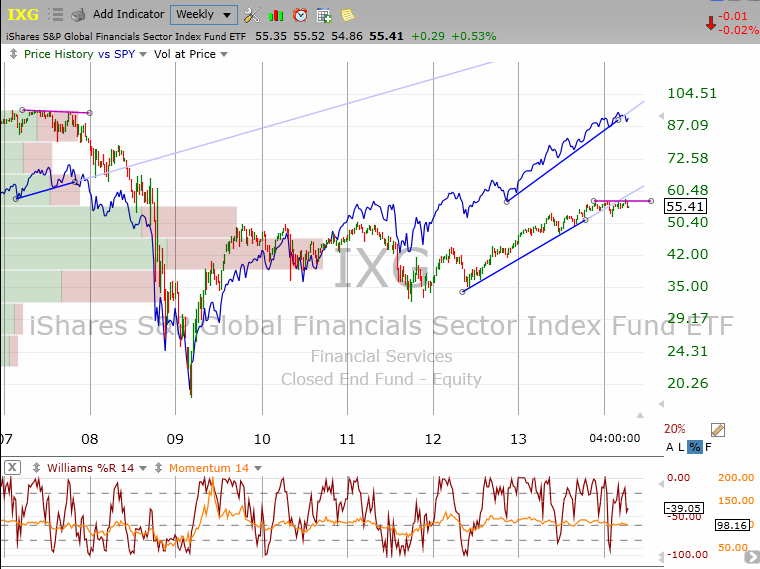
| Figure 2. Weekly chart comparing the iShares Global Financial ETF with the SPY showing the negative divergence in 2007. |
| Graphic provided by: TC2000.com. |
| |
| Note the negative divergence that occurred between financials and the S&P 500 in 2007 before the index dropped more than 40%. Financials have again diverged negatively from the SPY beginning in late 2013. This sector is worth watching to see if the financials continue this trend. |
|
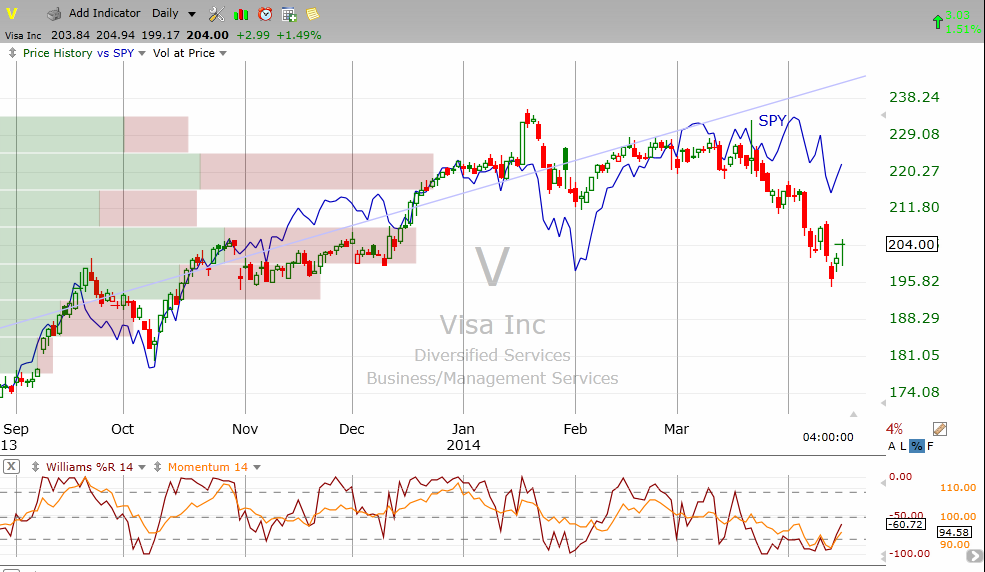
| Figure 3. Although not as precise, the relationship between credit card company VISA and the SPY is showing a disturbing divergence that began in March 2014 — an indication of reduced credit card (consumer) spending. |
| Graphic provided by: TC2000.com. |
| |
| Another indication of growing financial pressure is that major credit card company stocks, Visa (V) and MasterCard (MA), have broken long-standing up-trends. As Figure 3 shows, V has strongly diverged from the SPY trend putting in a lower low in April compared to a higher SPY low around the same time. |
|
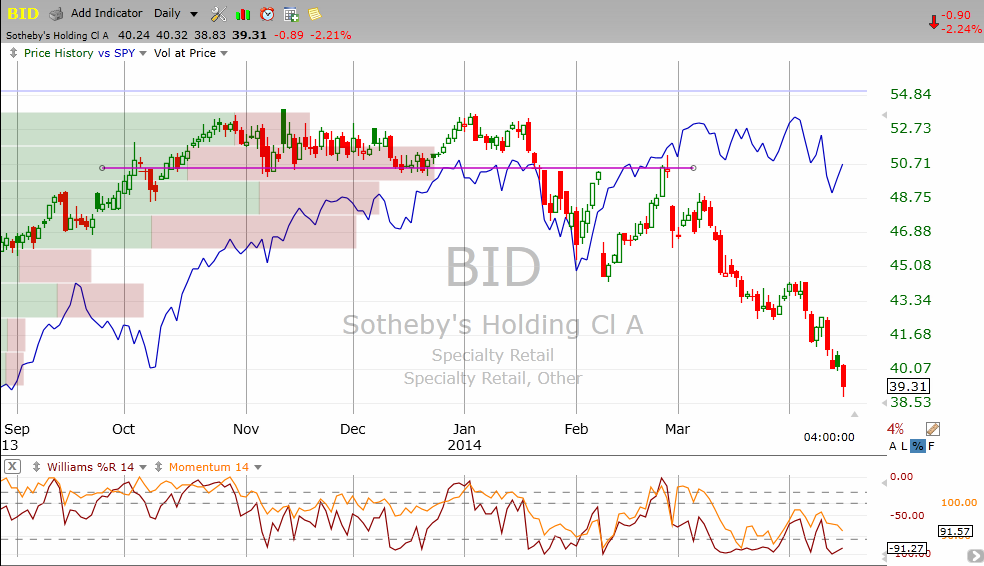
| Figure 4. Daily chart showing the SPY (blue) compared to bubble indicator Sotheby�s Auctioneers (BID) which posted a bearish double top chart pattern in late 2013 to early 2014 and has dropped nearly 30% since its peak in November 2013. |
| Graphic provided by: TC2000.com. |
| |
| Figure 4 is an update of the chart of 'bubble indicator' Sotheby's (BID) from my article entitled "Bubble Meter Says Animal Spirits Are Falling" showing irrational exuberance has continued to fall through 2014. It is interesting to note that the stock has dropped nearly 30% in the last four months and shows no signs of an imminent reversal. BID has been an excellent bubble indicator since it was launched in the late 1980s often dropping many months before stock prices experience a significant correction. |
Matt Blackman is a full-time technical and financial writer and trader. He produces corporate and financial newsletters, and assists clients in getting published in the mainstream media. He is the host of TradeSystemGuru.com. Matt has earned the Chartered Market Technician (CMT) designation. Find out what stocks and futures Matt is watching on Twitter at www.twitter.com/RatioTrade
| Company: | TradeSystemGuru.com |
| Address: | Box 2589 |
| Garibaldi Highlands, BC Canada | |
| Phone # for sales: | 604-898-9069 |
| Fax: | 604-898-9069 |
| Website: | www.tradesystemguru.com |
| E-mail address: | indextradermb@gmail.com |
Traders' Resource Links | |
| TradeSystemGuru.com has not added any product or service information to TRADERS' RESOURCE. | |
Click here for more information about our publications!
Comments

Request Information From Our Sponsors
- StockCharts.com, Inc.
- Candle Patterns
- Candlestick Charting Explained
- Intermarket Technical Analysis
- John Murphy on Chart Analysis
- John Murphy's Chart Pattern Recognition
- John Murphy's Market Message
- MurphyExplainsMarketAnalysis-Intermarket Analysis
- MurphyExplainsMarketAnalysis-Visual Analysis
- StockCharts.com
- Technical Analysis of the Financial Markets
- The Visual Investor
- VectorVest, Inc.
- Executive Premier Workshop
- One-Day Options Course
- OptionsPro
- Retirement Income Workshop
- Sure-Fire Trading Systems (VectorVest, Inc.)
- Trading as a Business Workshop
- VectorVest 7 EOD
- VectorVest 7 RealTime/IntraDay
- VectorVest AutoTester
- VectorVest Educational Services
- VectorVest OnLine
- VectorVest Options Analyzer
- VectorVest ProGraphics v6.0
- VectorVest ProTrader 7
- VectorVest RealTime Derby Tool
- VectorVest Simulator
- VectorVest Variator
- VectorVest Watchdog