

HOT TOPICS LIST
- MACD
- Fibonacci
- RSI
- Gann
- ADXR
- Stochastics
- Volume
- Triangles
- Futures
- Cycles
- Volatility
- ZIGZAG
- MESA
- Retracement
- Aroon
INDICATORS LIST
LIST OF TOPICS
PRINT THIS ARTICLE
by Matt Blackman
When auctioneer Sotheby's stock is rising, it means the auction business is growing and folks are feeling bullish about the future. When it falls, it usually signals that a risk-off trade should be considered.
Position: N/A
Matt Blackman
Matt Blackman is a full-time technical and financial writer and trader. He produces corporate and financial newsletters, and assists clients in getting published in the mainstream media. He is the host of TradeSystemGuru.com. Matt has earned the Chartered Market Technician (CMT) designation. Find out what stocks and futures Matt is watching on Twitter at www.twitter.com/RatioTrade
PRINT THIS ARTICLE
DIVERGENCE INDEX
BID Bubble Meter Says Animal Spirits Are Falling
04/04/14 04:17:51 PMby Matt Blackman
When auctioneer Sotheby's stock is rising, it means the auction business is growing and folks are feeling bullish about the future. When it falls, it usually signals that a risk-off trade should be considered.
Position: N/A
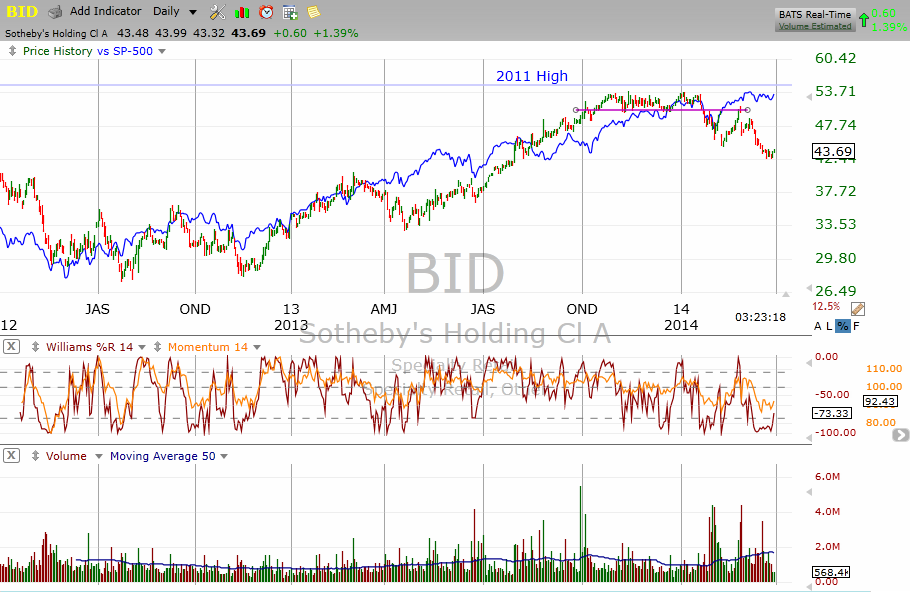
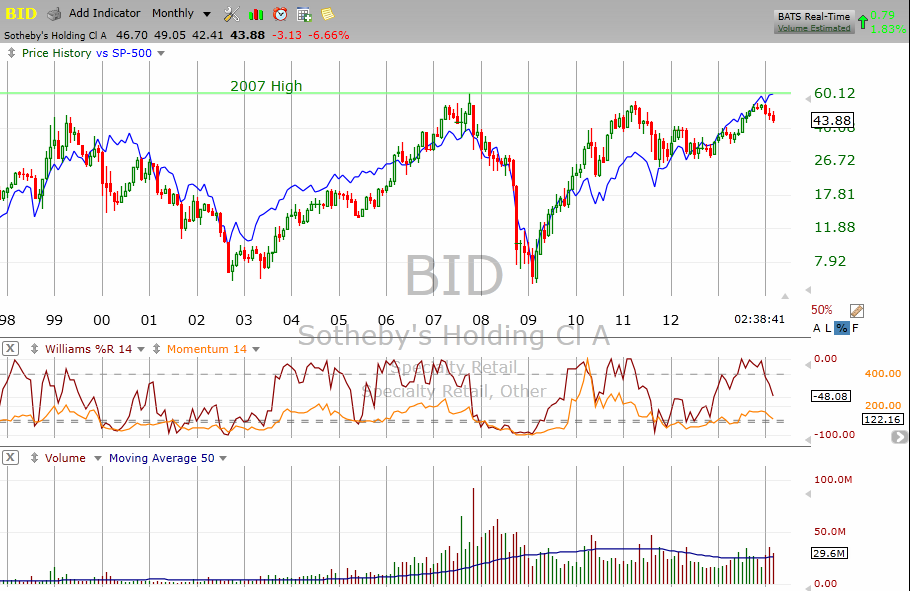
| In his excellent book, "Boombustology: Spotting Financial Bubbles Before They Burst," (John Wiley & Sons 2011) Vikram Mansharamani introduced readers to the idea that Sotheby's stock (BID) has been an excellent proxy for market bubbles. It provided a valuable warning in Japan in 1989 ahead of the 1990 Nikkei collapse and then again in 1999, BID peaked months ahead of the S&P 500. It also warned of the top in October 2007 but this time peaked around the same time as the S&P 500 index. It again provided advance warning of an impending top in early April 2011, nearly a month before the SPX peaked and then proceeded to lose more than 17% by year-end (Figure 1). |
|
| Figure 1. Daily chart of Sotheby�s compared to the S&P 500 (blue) showing the BID double top and building negative divergence with the index. |
| Graphic provided by: TC2000.com. |
| |
| So what has the stock been doing lately? BID hit a peak of $54 on November 12, 2013 before dropping to a low of $42.41 on March 27, 2014 and in the process confirmed a bearish double top chart pattern on January 24, 2014. However, after dropping in January, the S&P 500 continued higher to put in another all-time high in early March. It is interesting to note that the 2013 BID peak was a dollar short of the 2011 peak, further indication of negative divergence with the SPX (Figure 2). |
|
| Figure 2. Longer-term chart comparing BID with the S&P 500 from 1998 to 2014 showing the latest BID peak. Sotheby�s officially entered a bear market in early March 2014 after it dropped more than 20% from its 2013 peak. |
| Graphic provided by: TC2000.com. |
| |
| No indicator is 100% accurate so there is a chance that given BID is now in bear market mode, it is providing a false market top warning this time around. But given its accuracy in the past, this outcome must be considered less probable. |
| Suggested Reading: Could One Stock Provide A Reliable Bubble Meter? |
Matt Blackman is a full-time technical and financial writer and trader. He produces corporate and financial newsletters, and assists clients in getting published in the mainstream media. He is the host of TradeSystemGuru.com. Matt has earned the Chartered Market Technician (CMT) designation. Find out what stocks and futures Matt is watching on Twitter at www.twitter.com/RatioTrade
| Company: | TradeSystemGuru.com |
| Address: | Box 2589 |
| Garibaldi Highlands, BC Canada | |
| Phone # for sales: | 604-898-9069 |
| Fax: | 604-898-9069 |
| Website: | www.tradesystemguru.com |
| E-mail address: | indextradermb@gmail.com |
Traders' Resource Links | |
| TradeSystemGuru.com has not added any product or service information to TRADERS' RESOURCE. | |
Click here for more information about our publications!
PRINT THIS ARTICLE

Request Information From Our Sponsors
- StockCharts.com, Inc.
- Candle Patterns
- Candlestick Charting Explained
- Intermarket Technical Analysis
- John Murphy on Chart Analysis
- John Murphy's Chart Pattern Recognition
- John Murphy's Market Message
- MurphyExplainsMarketAnalysis-Intermarket Analysis
- MurphyExplainsMarketAnalysis-Visual Analysis
- StockCharts.com
- Technical Analysis of the Financial Markets
- The Visual Investor
- VectorVest, Inc.
- Executive Premier Workshop
- One-Day Options Course
- OptionsPro
- Retirement Income Workshop
- Sure-Fire Trading Systems (VectorVest, Inc.)
- Trading as a Business Workshop
- VectorVest 7 EOD
- VectorVest 7 RealTime/IntraDay
- VectorVest AutoTester
- VectorVest Educational Services
- VectorVest OnLine
- VectorVest Options Analyzer
- VectorVest ProGraphics v6.0
- VectorVest ProTrader 7
- VectorVest RealTime Derby Tool
- VectorVest Simulator
- VectorVest Variator
- VectorVest Watchdog