HOT TOPICS LIST
- MACD
- Fibonacci
- RSI
- Gann
- ADXR
- Stochastics
- Volume
- Triangles
- Futures
- Cycles
- Volatility
- ZIGZAG
- MESA
- Retracement
- Aroon
INDICATORS LIST
LIST OF TOPICS
PRINT THIS ARTICLE
by Koos van der Merwe
Often a pattern will start developing a left shoulder and a head. Then there will be the inevitable wait for the right shoulder to develop in order to form a true head and shoulder pattern. If the right shoulder does not develop, could it be a cup and saucer pattern instead? The share Vaxgen Inc. [VXGN] appears to be developing such a pattern.
Position: Hold
Koos van der Merwe
Has been a technical analyst since 1969, and has worked as a futures and options trader with First Financial Futures in Johannesburg, South Africa.
PRINT THIS ARTICLE
HEAD & SHOULDERS
Head & Shoulders or Cup & Saucer?
10/11/02 11:44:50 AMby Koos van der Merwe
Often a pattern will start developing a left shoulder and a head. Then there will be the inevitable wait for the right shoulder to develop in order to form a true head and shoulder pattern. If the right shoulder does not develop, could it be a cup and saucer pattern instead? The share Vaxgen Inc. [VXGN] appears to be developing such a pattern.
Position: Hold
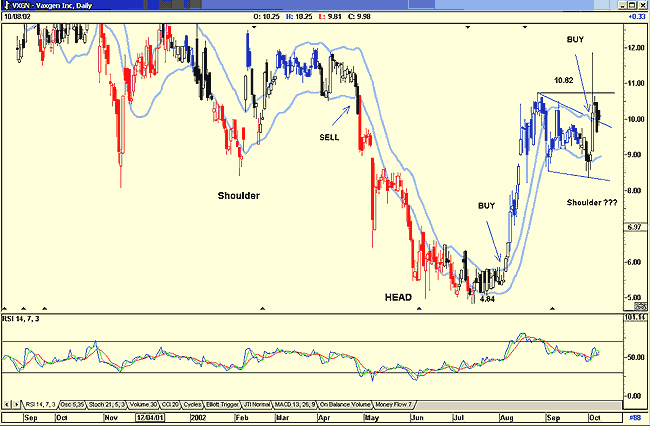
| In the chart below you can clearly see an inverse head and shoulders pattern in the making. The question is, has the right shoulder fully developed or has it a way to go? |
| The RSI indicator is suggesting further downside because it is moving downwards from an overbought position, but the JM internal trading band has given a second buy signal, and the pennant, if it could be called that, has also suggested a buy signal as the price broke out of the upper downsloping trendline. Finally the close did test the resistance level at $10.82, actually exceeding it with the high of the day, but then fell back to below resistance. Now what will happen? |

|
| Head and Shoulder or Cup and Saucer ? |
| Graphic provided by: AdvancedGET. |
| |
| Those who were lucky enough to have bought the share at $6 or less should place their stop orders as close to the high reached as possible. For some verification, a recent article in Technical Analysis of Stocks & Commodities proved that a 5% stop from the high was the most profitable. Those who are tempted to buy at present levels because of the JM buy signal are hesitant because of a downtrending RSI indicator. So we then look to the cup and saucer buy signal, which would be a closing price above $10.82 as the buy signal with a possible target of $16. |
| I arrived at the buy signal using the following equation. The depth of the cup: 10.82 - 4.84 = 6. (rounded off) 10.82 + 6 = 16.82, which I have rounded off to $16.00. This share should be watched for a future trade. |
Has been a technical analyst since 1969, and has worked as a futures and options trader with First Financial Futures in Johannesburg, South Africa.
| Address: | 3256 West 24th Ave |
| Vancouver, BC | |
| Phone # for sales: | 6042634214 |
| E-mail address: | petroosp@gmail.com |
Click here for more information about our publications!
Comments
Date: 10/16/02Rank: 1Comment:
Date: 10/23/02Rank: 3Comment: good explanation.
something like my CPO charts.
TQ.

|

Request Information From Our Sponsors
- StockCharts.com, Inc.
- Candle Patterns
- Candlestick Charting Explained
- Intermarket Technical Analysis
- John Murphy on Chart Analysis
- John Murphy's Chart Pattern Recognition
- John Murphy's Market Message
- MurphyExplainsMarketAnalysis-Intermarket Analysis
- MurphyExplainsMarketAnalysis-Visual Analysis
- StockCharts.com
- Technical Analysis of the Financial Markets
- The Visual Investor
- VectorVest, Inc.
- Executive Premier Workshop
- One-Day Options Course
- OptionsPro
- Retirement Income Workshop
- Sure-Fire Trading Systems (VectorVest, Inc.)
- Trading as a Business Workshop
- VectorVest 7 EOD
- VectorVest 7 RealTime/IntraDay
- VectorVest AutoTester
- VectorVest Educational Services
- VectorVest OnLine
- VectorVest Options Analyzer
- VectorVest ProGraphics v6.0
- VectorVest ProTrader 7
- VectorVest RealTime Derby Tool
- VectorVest Simulator
- VectorVest Variator
- VectorVest Watchdog
