HOT TOPICS LIST
- MACD
- Fibonacci
- RSI
- Gann
- ADXR
- Stochastics
- Volume
- Triangles
- Futures
- Cycles
- Volatility
- ZIGZAG
- MESA
- Retracement
- Aroon
INDICATORS LIST
LIST OF TOPICS
PRINT THIS ARTICLE
by Koos van der Merwe
I-Units are exchange traded funds that are traded like stocks on the Toronto stock exchange. They mirror the underlying index.
Position: Hold
Koos van der Merwe
Has been a technical analyst since 1969, and has worked as a futures and options trader with First Financial Futures in Johannesburg, South Africa.
PRINT THIS ARTICLE
MA ENVELOPES
Trading the I-Unit S&P/TSE Gold Index
09/27/02 10:09:59 AMby Koos van der Merwe
I-Units are exchange traded funds that are traded like stocks on the Toronto stock exchange. They mirror the underlying index.
Position: Hold
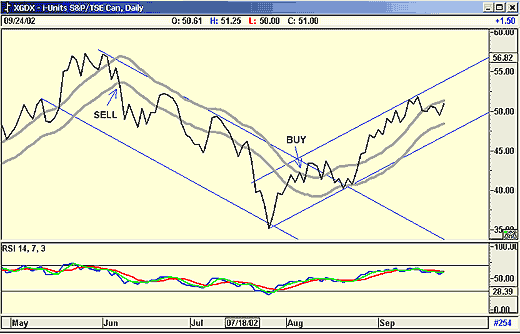
| In my previous article "Technical Simplicity" I showed you the JM technique of market direction using the QQQs as an example. In my analysis I used a moving average as a closing trigger. In this analysis of the I-Unit S&P/TSE Gold Index, I have left out the moving average trigger, relying instead on a stop-loss and basic JM strategy. |
| To recap, the JM strategy is a 15-period moving average offset by a positive and a negative percentage. I have found that 2% works in most instances, but in certain circumstances 3% and even 5% can be used. The object is to look for interim turning points within the bands without triggering too many buy or sell signals. With this chart, I found that 3% was the best percentage to use, and the moving average is therefore offset by 3% and -3%. Occasionally, the positive and negative percentages can vary, using 3% and -2% for example, but I have found this to be a rare occurrence. The following chart is of the I-Unit Gold Index. |

|
| Figure 1: Gold S&P/TSE Canadian Gold Index. This chart shows entry and exit points for a shorting opportunity. |
| Graphic provided by: AdvancedGET. |
| |
| I have placed trendlines on the chart so you can see how the JM strategy is inclined to act before a trendline is broken, even keeping you in the market when a resistance line becomes a support line as shown at the "BUY" signal. |
| At the moment, the chart is still positive, and any bounce off the lower moving average band can be considered a position to add stock to your holdings, as long as the RSI indicator is not in an overbought position. |
| I have looked at using the strategy with a bar chart or a candlestick chart, but found that it worked better with a line chart of the closing price only. It is a very conservative strategy. You will only enter the market in the direction of the trend. I have seen on more than one occasion, that a price will break the upper band then continue drifting down using the upper MA as a support level. Most times when this occurs, a stop-loss takes you out of the market for a small loss. On the whole however, the strategy is an excellent addition to your quiver of technical tools. |
Has been a technical analyst since 1969, and has worked as a futures and options trader with First Financial Futures in Johannesburg, South Africa.
| Address: | 3256 West 24th Ave |
| Vancouver, BC | |
| Phone # for sales: | 6042634214 |
| E-mail address: | petroosp@gmail.com |
Click here for more information about our publications!
PRINT THIS ARTICLE

Request Information From Our Sponsors
- VectorVest, Inc.
- Executive Premier Workshop
- One-Day Options Course
- OptionsPro
- Retirement Income Workshop
- Sure-Fire Trading Systems (VectorVest, Inc.)
- Trading as a Business Workshop
- VectorVest 7 EOD
- VectorVest 7 RealTime/IntraDay
- VectorVest AutoTester
- VectorVest Educational Services
- VectorVest OnLine
- VectorVest Options Analyzer
- VectorVest ProGraphics v6.0
- VectorVest ProTrader 7
- VectorVest RealTime Derby Tool
- VectorVest Simulator
- VectorVest Variator
- VectorVest Watchdog
- StockCharts.com, Inc.
- Candle Patterns
- Candlestick Charting Explained
- Intermarket Technical Analysis
- John Murphy on Chart Analysis
- John Murphy's Chart Pattern Recognition
- John Murphy's Market Message
- MurphyExplainsMarketAnalysis-Intermarket Analysis
- MurphyExplainsMarketAnalysis-Visual Analysis
- StockCharts.com
- Technical Analysis of the Financial Markets
- The Visual Investor
