HOT TOPICS LIST
- MACD
- Fibonacci
- RSI
- Gann
- ADXR
- Stochastics
- Volume
- Triangles
- Futures
- Cycles
- Volatility
- ZIGZAG
- MESA
- Retracement
- Aroon
INDICATORS LIST
LIST OF TOPICS
PRINT THIS ARTICLE
by Koos van der Merwe
Gold has been demonetized. In the past, world economies based the strength of their currencies on the price of gold. For the past ten years or so, this has no longer been the case.
Position: Buy
Koos van der Merwe
Has been a technical analyst since 1969, and has worked as a futures and options trader with First Financial Futures in Johannesburg, South Africa.
PRINT THIS ARTICLE
TREND-CHANNEL
How Now Gold?
10/10/02 11:51:16 AMby Koos van der Merwe
Gold has been demonetized. In the past, world economies based the strength of their currencies on the price of gold. For the past ten years or so, this has no longer been the case.
Position: Buy
| Currencies peg their value against the $US, British Pound, Swiss Franc, or a basket of currencies. When I worked as a gold analyst for a major stockbroker in South Africa, I realized that there was probably more gold in central bank vaults above ground, than there was in mines, underground. When those central banks started selling gold, various mines realized that the long-term trend for gold was down and started selling gold forward and locking in a fixed price. At that point I found I could no longer read a gold chart. Eight years ago, Elaine Gazerelli said, "In today's sophisticated markets, it is far easier and quicker, to hedge my portfolio in the futures market than to liquidate my portfolios and buy gold." |
| Today, with gold's recent recovery as a safe haven in a time of uncertainty, I have decided to look at gold again. |

|
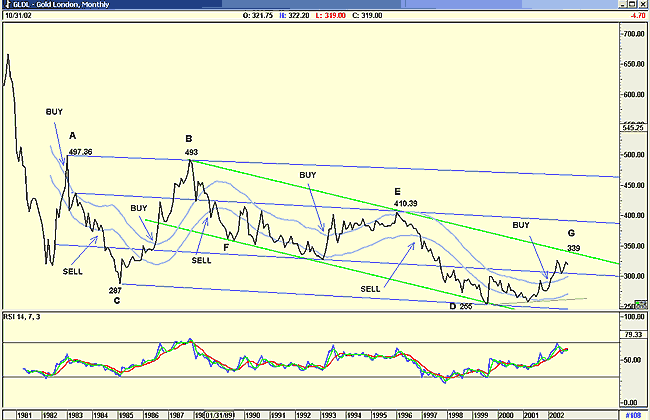
| Figure 1: My forecast for London Gold. |
| Graphic provided by: AdvancedGET. |
| |
| Above is a monthly chart of gold with various trendlines drawn off support and resistance levels. The upper trendline, AB, started from the two highs and paralleled the bottom lows, CD. I then drew two internal lines in an attempt to find support and resistance levels in the longer term. I also drew the trendlines (green) from B, E, and G and paralleled it with the support line FD. Finally, I added a JM internal band (see previous articles) with a 5% offset, and a 14-month RSI indicator. |
| The result shows the JM internal band, a conservative indicator, confirms the RSI indicator, which gave a buy signal that was a tad too early. Both confirm that gold is in a short-term bull trend, within a longer term bear trend, as outlined by the resistance line B, E, and G and suggest that gold could test $339 before falling back to the trendline FD and find support at a level below $255 (not shown on the chart). The RSI could probably be at overbought levels (above 70) by this time, confirming the above. |
| So, my hopes for gold over the short-term are bullish, but over the long-term are very, very bearish. |
Has been a technical analyst since 1969, and has worked as a futures and options trader with First Financial Futures in Johannesburg, South Africa.
| Address: | 3256 West 24th Ave |
| Vancouver, BC | |
| Phone # for sales: | 6042634214 |
| E-mail address: | petroosp@gmail.com |
Click here for more information about our publications!
Comments
Date: 10/10/02Rank: 1Comment: You neglect to mention the double bottom in gold as compared to previous bottoms. You also make the assumption that gold will not make it past the 339 resistance. You also neglect to consider that the fundamentals for gold are the best that they have been since the late 70 s early 80 s.
Date: 10/13/02Rank: 2Comment:
Date: 10/24/02Rank: 4Comment:

Request Information From Our Sponsors
- StockCharts.com, Inc.
- Candle Patterns
- Candlestick Charting Explained
- Intermarket Technical Analysis
- John Murphy on Chart Analysis
- John Murphy's Chart Pattern Recognition
- John Murphy's Market Message
- MurphyExplainsMarketAnalysis-Intermarket Analysis
- MurphyExplainsMarketAnalysis-Visual Analysis
- StockCharts.com
- Technical Analysis of the Financial Markets
- The Visual Investor
- VectorVest, Inc.
- Executive Premier Workshop
- One-Day Options Course
- OptionsPro
- Retirement Income Workshop
- Sure-Fire Trading Systems (VectorVest, Inc.)
- Trading as a Business Workshop
- VectorVest 7 EOD
- VectorVest 7 RealTime/IntraDay
- VectorVest AutoTester
- VectorVest Educational Services
- VectorVest OnLine
- VectorVest Options Analyzer
- VectorVest ProGraphics v6.0
- VectorVest ProTrader 7
- VectorVest RealTime Derby Tool
- VectorVest Simulator
- VectorVest Variator
- VectorVest Watchdog
