

HOT TOPICS LIST
- MACD
- Fibonacci
- RSI
- Gann
- ADXR
- Stochastics
- Volume
- Triangles
- Futures
- Cycles
- Volatility
- ZIGZAG
- MESA
- Retracement
- Aroon
INDICATORS LIST
LIST OF TOPICS
PRINT THIS ARTICLE
by Matt Blackman
Even though the overall market has been relatively strong, the same can't be said for 3D printers.
Position: N/A
Matt Blackman
Matt Blackman is a full-time technical and financial writer and trader. He produces corporate and financial newsletters, and assists clients in getting published in the mainstream media. He is the host of TradeSystemGuru.com. Matt has earned the Chartered Market Technician (CMT) designation. Find out what stocks and futures Matt is watching on Twitter at www.twitter.com/RatioTrade
PRINT THIS ARTICLE
HEAD & SHOULDERS
Are 3D Printers On The Ropes?
03/31/14 05:35:41 PMby Matt Blackman
Even though the overall market has been relatively strong, the same can't be said for 3D printers.
Position: N/A
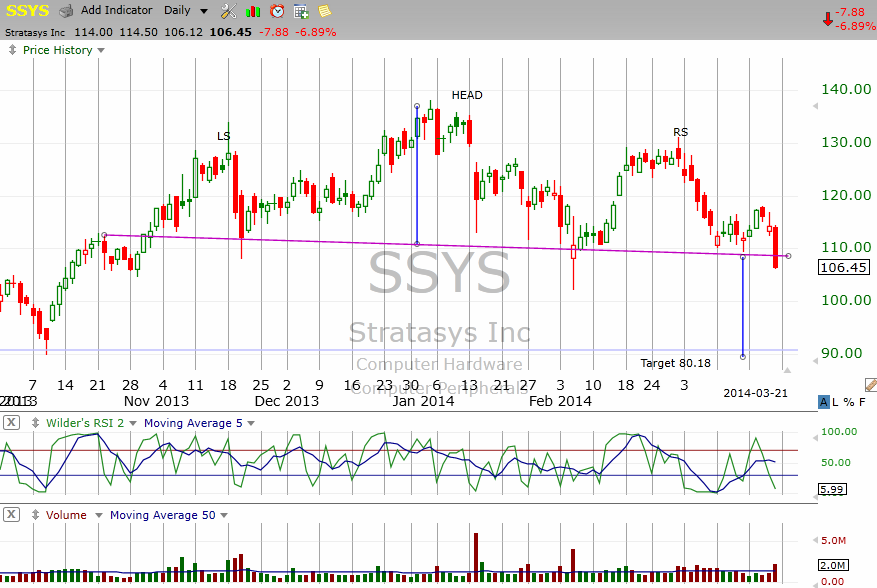
| In my article "3D Printers Flash Top Warning," I discussed the bearish patterns appearing on two of the major 3D printing companies. On March 21, 2014 those patterns were confirmed. As you see in Figure 1, Stratasys Inc. broke its head & shoulders neckline support around $106.80 thereby confirming the pattern on greater than average volume. The minimum projected downside target for the pattern is $80.18 which would take the stock down more than 20% from its March 21, 2014 close. It is also more than $4 below the estimated downside target arrived at on March 11, 2014 in the above article (before the breach was confirmed). |
|
| Figure 1 � Daily chart of Stratasys. Inc. showing the confirmation of the bearish Head & Shoulders top pattern. |
| Graphic provided by: TC2000.com. |
| |
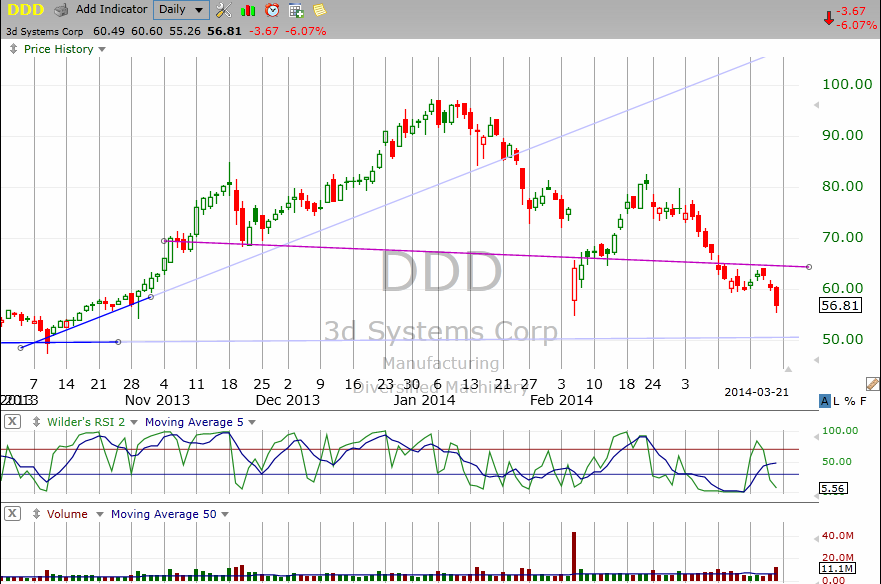
| 3D Systems Corp has been flashing a similar pattern except that the beginning of the right shoulder was significantly lower thanks to a large gap that occurred February 5, 2014. As you see in Figure 2, DDD broke down through the neckline again on March 10, 2014 before mounting a weak recovery rally only to hit neckline resistance March 19, 2014 which proved unbreakable thereby confirming the neckline. A minimum projected downside target of $35.49 was arrived at by subtracting the height of the head from the neckline, then subtracting that number from the neckline at the March 10, 2014 breach. |
|
| Figure 2 � Daily chart of 3D Systems Corp showing the bearish Head & Shoulders pattern with unconventional right shoulder breach, rally then re-breach and failed retest before the stock turned lower again. |
| Graphic provided by: TC2000.com. |
| |
| For the bearish targets for both SSYS and DDD to be reached, the overall stock market will need to experience weakness in the weeks or months ahead. DDD experienced a big increase between May 2012 and its peak in January 2014 and SSYS grew more than 300% (three-bagger) over the same period. Both appear to be experiencing strong reversion to the mean corrections that still have some way to go. |
| Only time will tell if these companies will be able to mount effective recoveries again once this process is over. It will also be worthwhile watching how new entrants to the field like German company SLM Solutions GmbH fare in their initial public offerings. According to consultants Wohlers Associates, the 3D printing industry could nearly triple to $6 billion annually by 2017 (see http://goo.gl/Iui8BI ). |
Matt Blackman is a full-time technical and financial writer and trader. He produces corporate and financial newsletters, and assists clients in getting published in the mainstream media. He is the host of TradeSystemGuru.com. Matt has earned the Chartered Market Technician (CMT) designation. Find out what stocks and futures Matt is watching on Twitter at www.twitter.com/RatioTrade
| Company: | TradeSystemGuru.com |
| Address: | Box 2589 |
| Garibaldi Highlands, BC Canada | |
| Phone # for sales: | 604-898-9069 |
| Fax: | 604-898-9069 |
| Website: | www.tradesystemguru.com |
| E-mail address: | indextradermb@gmail.com |
Traders' Resource Links | |
| TradeSystemGuru.com has not added any product or service information to TRADERS' RESOURCE. | |
Click here for more information about our publications!
PRINT THIS ARTICLE

Request Information From Our Sponsors
- VectorVest, Inc.
- Executive Premier Workshop
- One-Day Options Course
- OptionsPro
- Retirement Income Workshop
- Sure-Fire Trading Systems (VectorVest, Inc.)
- Trading as a Business Workshop
- VectorVest 7 EOD
- VectorVest 7 RealTime/IntraDay
- VectorVest AutoTester
- VectorVest Educational Services
- VectorVest OnLine
- VectorVest Options Analyzer
- VectorVest ProGraphics v6.0
- VectorVest ProTrader 7
- VectorVest RealTime Derby Tool
- VectorVest Simulator
- VectorVest Variator
- VectorVest Watchdog
- StockCharts.com, Inc.
- Candle Patterns
- Candlestick Charting Explained
- Intermarket Technical Analysis
- John Murphy on Chart Analysis
- John Murphy's Chart Pattern Recognition
- John Murphy's Market Message
- MurphyExplainsMarketAnalysis-Intermarket Analysis
- MurphyExplainsMarketAnalysis-Visual Analysis
- StockCharts.com
- Technical Analysis of the Financial Markets
- The Visual Investor