HOT TOPICS LIST
- MACD
- Fibonacci
- RSI
- Gann
- ADXR
- Stochastics
- Volume
- Triangles
- Futures
- Cycles
- Volatility
- ZIGZAG
- MESA
- Retracement
- Aroon
INDICATORS LIST
LIST OF TOPICS
PRINT THIS ARTICLE
by Matt Blackman
In February, I wrote that 3D printing stocks looked to have resumed rally mode again after a sizable correction. But now with the appearance of bearish topping patterns, that rally looks to be in jeopardy.
Position: N/A
Matt Blackman
Matt Blackman is a full-time technical and financial writer and trader. He produces corporate and financial newsletters, and assists clients in getting published in the mainstream media. He is the host of TradeSystemGuru.com. Matt has earned the Chartered Market Technician (CMT) designation. Find out what stocks and futures Matt is watching on Twitter at www.twitter.com/RatioTrade
PRINT THIS ARTICLE
HEAD & SHOULDERS
3D Printers Flashing Top Warning
03/11/14 04:34:00 PMby Matt Blackman
In February, I wrote that 3D printing stocks looked to have resumed rally mode again after a sizable correction. But now with the appearance of bearish topping patterns, that rally looks to be in jeopardy.
Position: N/A
| In my article entitled "3D Printers - Is the Game Back On?" we looked at the charts of four companies in the 3D printing space that appeared to be rallying again after corrections. But in the two weeks since, two of the biggest players — 3D Systems Corp. and StrataSys Inc. — have given back prior recent gains and are now flashing disturbing head & shoulders (H&S) chart patterns that, if confirmed with decisive neckline breaches, would signal that all bullish bets are off in favor of taking short positions. |

|
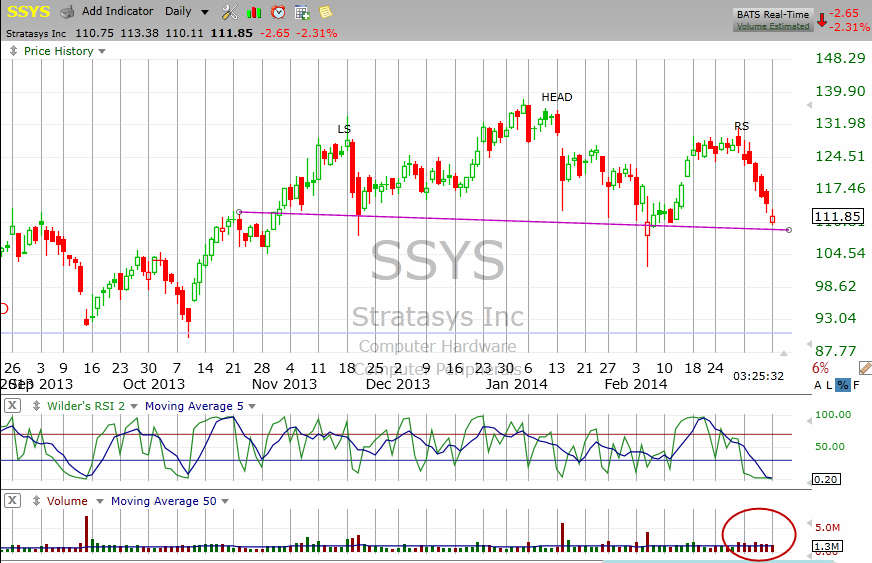
| Figure 1 – Daily chart of StratSys Inc. showing the breakdown in the stock in late February and early March 2014 to form a nearly complete bearish Head & Shoulders pattern with neckline around $109.50. |
| Graphic provided by: TC2000.com. |
| |
| A decisive neckline breach in Figure 1 should be accompanied by a large increase in selling volume to well above the 50-day volume moving average (blue line) to give the pattern further credibility (see red oval). A minimum projected short trade target of $84.05 for SSYS is arrived at by taking the difference between height of the head and the neckline and then subtracting that total from the neckline at the breach point. This would take the stock back to where it was trading in July 2013. |
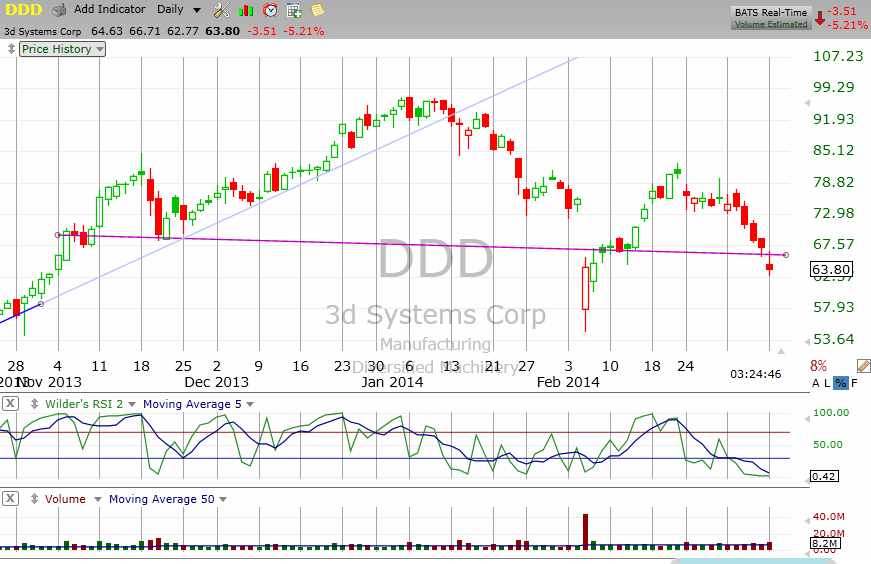
| Although not as well-defined, the H&S pattern on 3D Systems Corp in Figure 2 is equally bearish except that it could be argued that the neckline is technically at $57.93, well below where the stock was sitting in the chart below. |

|
| Figure 2 – Daily chart of 3D Systems Corp showing a similar H&S pattern but with big drop to begin the right shoulder. Even though the pattern is not as precise, it is no less bearish. |
| Graphic provided by: TC2000.com. |
| |
| As stated in "3D Printers - Is the Game Back On?" the assumption that "as long as the current rally continues to gather steam, 3D printers look set to lead the way once again," is looking less certain at this point. |
| However, if the rally does resume and the H&S patterns are invalidated with both stocks resuming rallies, all bearish analysis would be rendered moot. This would confirm another theorem in technical analysis that a pattern failure is often an excellent opportunity to take the opposite tack. |
Matt Blackman is a full-time technical and financial writer and trader. He produces corporate and financial newsletters, and assists clients in getting published in the mainstream media. He is the host of TradeSystemGuru.com. Matt has earned the Chartered Market Technician (CMT) designation. Find out what stocks and futures Matt is watching on Twitter at www.twitter.com/RatioTrade
| Company: | TradeSystemGuru.com |
| Address: | Box 2589 |
| Garibaldi Highlands, BC Canada | |
| Phone # for sales: | 604-898-9069 |
| Fax: | 604-898-9069 |
| Website: | www.tradesystemguru.com |
| E-mail address: | indextradermb@gmail.com |
Traders' Resource Links | |
| TradeSystemGuru.com has not added any product or service information to TRADERS' RESOURCE. | |
Click here for more information about our publications!
PRINT THIS ARTICLE

Request Information From Our Sponsors
- StockCharts.com, Inc.
- Candle Patterns
- Candlestick Charting Explained
- Intermarket Technical Analysis
- John Murphy on Chart Analysis
- John Murphy's Chart Pattern Recognition
- John Murphy's Market Message
- MurphyExplainsMarketAnalysis-Intermarket Analysis
- MurphyExplainsMarketAnalysis-Visual Analysis
- StockCharts.com
- Technical Analysis of the Financial Markets
- The Visual Investor
- VectorVest, Inc.
- Executive Premier Workshop
- One-Day Options Course
- OptionsPro
- Retirement Income Workshop
- Sure-Fire Trading Systems (VectorVest, Inc.)
- Trading as a Business Workshop
- VectorVest 7 EOD
- VectorVest 7 RealTime/IntraDay
- VectorVest AutoTester
- VectorVest Educational Services
- VectorVest OnLine
- VectorVest Options Analyzer
- VectorVest ProGraphics v6.0
- VectorVest ProTrader 7
- VectorVest RealTime Derby Tool
- VectorVest Simulator
- VectorVest Variator
- VectorVest Watchdog
