

HOT TOPICS LIST
- MACD
- Fibonacci
- RSI
- Gann
- ADXR
- Stochastics
- Volume
- Triangles
- Futures
- Cycles
- Volatility
- ZIGZAG
- MESA
- Retracement
- Aroon
INDICATORS LIST
LIST OF TOPICS
PRINT THIS ARTICLE
by Matt Blackman
"Rumors of my death have been greatly exaggerated." Mark Twain
Position: N/A
Matt Blackman
Matt Blackman is a full-time technical and financial writer and trader. He produces corporate and financial newsletters, and assists clients in getting published in the mainstream media. He is the host of TradeSystemGuru.com. Matt has earned the Chartered Market Technician (CMT) designation. Find out what stocks and futures Matt is watching on Twitter at www.twitter.com/RatioTrade
PRINT THIS ARTICLE
FIBONACCI
3D Printers - Is The Game Back On?
02/24/14 04:25:46 PMby Matt Blackman
"Rumors of my death have been greatly exaggerated." Mark Twain
Position: N/A
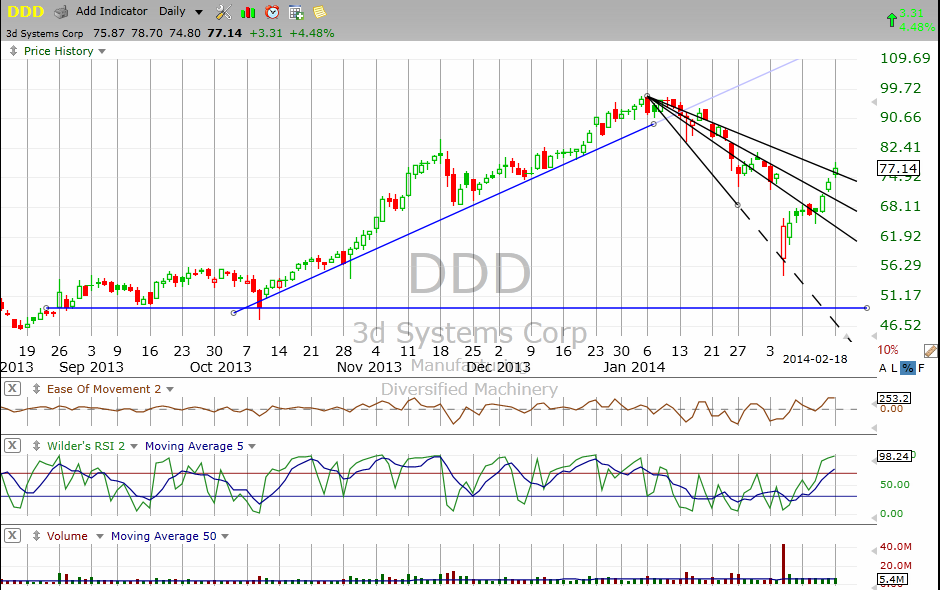
| In October I alerted traders that 3D printing company 3D Systems Corporation was set to take off based on a combination of technical action and positive seasonal factors in "Is October The Season For 3D Printers?". In the fourth quarter of 2013, 3D Systems Corp. (DDD) soared more than 40% into the first week in January 2014 (Figure 1). |
|
| Figure 1 � Daily chart showing correction and comeback by 3 D Systems Corp (DDD) which broke through the Fibonacci Fan 0.618 retracement line and rallied more than 30% off the bottom. |
| Graphic provided by: TC2000.com. |
| |
| But then 3D stocks took it on the chin as the market correction took hold, losing more than 40%, prompting many traders to declare that the 3D game was over. But since bottoming in early February, the charts are telling a different story. |
|
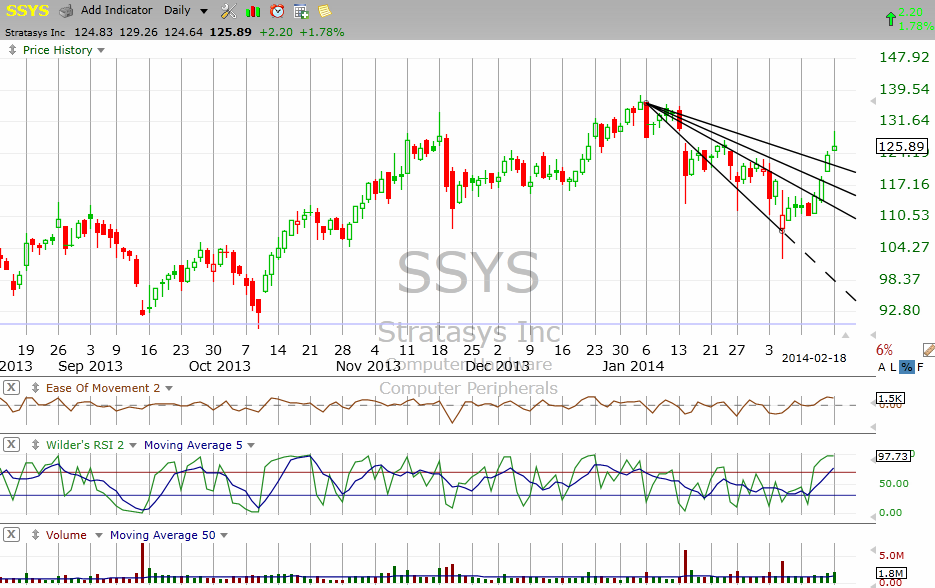
| Figure 2 � Daily chart of 3D printer StrataSys Ltd. with the Fibonacci Fan showing the powerful bounce off the February bottom. |
| Graphic provided by: TC2000.com. |
| |
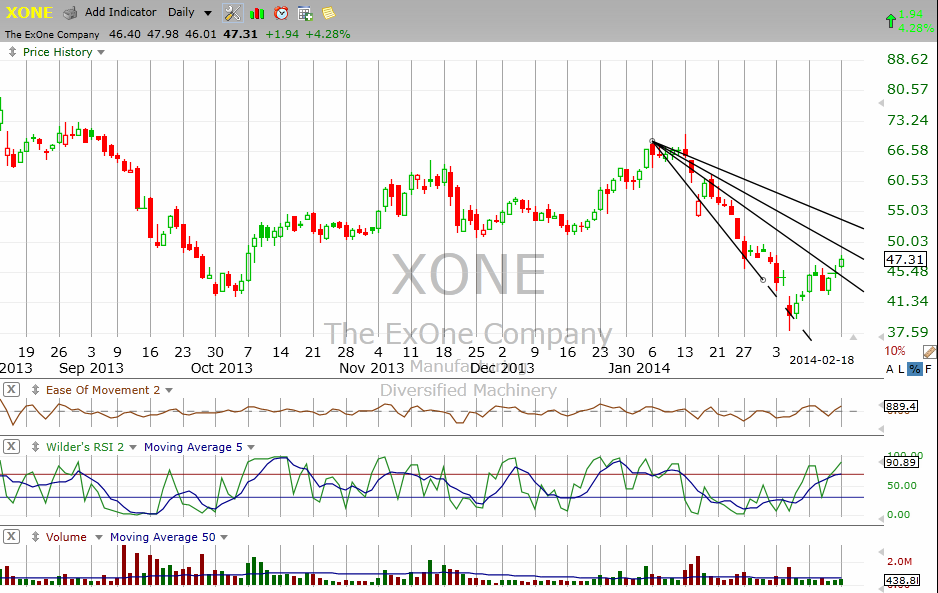
| Two of the major publicly traded companies in the space — DDD and Stratasys Inc. (SSYS) — have registered better than 25% retracements in eight trading days since the stocks bottomed February 5, 2014. And as opposed to rolling over, both look to be gaining momentum as evidenced by the gaps in the second week and into the third trading week of February. Another 3D printing company, The ExOne Company (XONE), has shown a similar retracement on its daily chart (Figure 3). |
|
| Figure 3 � Daily chart of The ExOne Company showing the recovery since bottoming in February. |
| Graphic provided by: TC2000.com. |
| |
| Fundamentally speaking, DDD and SSYS have experienced revenue growth in the last four quarters of 43% and 123% with sales in the last year of $460 and $400 million respectively. Earnings per share were $0.18 for DDD but SSYS lost $0.16 in its latest quarter according to the latest data from TC2000.com. |
|
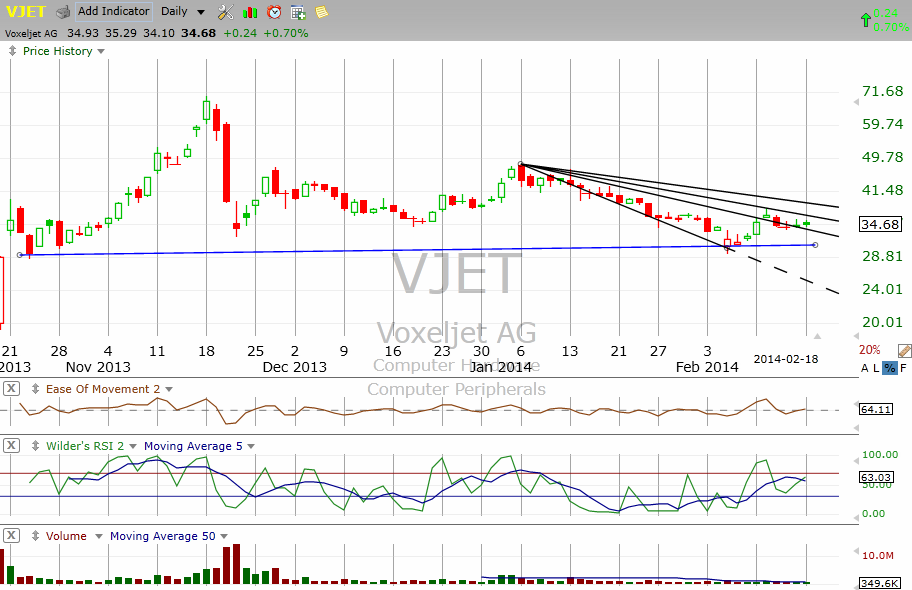
| Figure 4 � Daily chart of 3D print manufacturer VoxelJet AG showing the more modest rally off the February lows. |
| Graphic provided by: TC2000.com. |
| |
| Another 3D printing company, Voxeljet (VJET), a newer entry to the space, also bears watching but it has been weaker in 2014 than the three candidates above and has yet to mount a concerted rally. It registered earnings per share in the latest quarter of $0.11. As long as the current rally continues to gather steam, 3 D printers look set to lead the way once again. |
Matt Blackman is a full-time technical and financial writer and trader. He produces corporate and financial newsletters, and assists clients in getting published in the mainstream media. He is the host of TradeSystemGuru.com. Matt has earned the Chartered Market Technician (CMT) designation. Find out what stocks and futures Matt is watching on Twitter at www.twitter.com/RatioTrade
| Company: | TradeSystemGuru.com |
| Address: | Box 2589 |
| Garibaldi Highlands, BC Canada | |
| Phone # for sales: | 604-898-9069 |
| Fax: | 604-898-9069 |
| Website: | www.tradesystemguru.com |
| E-mail address: | indextradermb@gmail.com |
Traders' Resource Links | |
| TradeSystemGuru.com has not added any product or service information to TRADERS' RESOURCE. | |
Click here for more information about our publications!
Comments

Request Information From Our Sponsors
- StockCharts.com, Inc.
- Candle Patterns
- Candlestick Charting Explained
- Intermarket Technical Analysis
- John Murphy on Chart Analysis
- John Murphy's Chart Pattern Recognition
- John Murphy's Market Message
- MurphyExplainsMarketAnalysis-Intermarket Analysis
- MurphyExplainsMarketAnalysis-Visual Analysis
- StockCharts.com
- Technical Analysis of the Financial Markets
- The Visual Investor
- VectorVest, Inc.
- Executive Premier Workshop
- One-Day Options Course
- OptionsPro
- Retirement Income Workshop
- Sure-Fire Trading Systems (VectorVest, Inc.)
- Trading as a Business Workshop
- VectorVest 7 EOD
- VectorVest 7 RealTime/IntraDay
- VectorVest AutoTester
- VectorVest Educational Services
- VectorVest OnLine
- VectorVest Options Analyzer
- VectorVest ProGraphics v6.0
- VectorVest ProTrader 7
- VectorVest RealTime Derby Tool
- VectorVest Simulator
- VectorVest Variator
- VectorVest Watchdog