HOT TOPICS LIST
- MACD
- Fibonacci
- RSI
- Gann
- ADXR
- Stochastics
- Volume
- Triangles
- Futures
- Cycles
- Volatility
- ZIGZAG
- MESA
- Retracement
- Aroon
INDICATORS LIST
LIST OF TOPICS
PRINT THIS ARTICLE
by Matt Blackman
Like much of the market, 3D stocks took a hit leading up to the budget feud on Capital Hill. But, for traders, there is an interesting seasonal pattern that could present itself when the feud ends.
Position: N/A
Matt Blackman
Matt Blackman is a full-time technical and financial writer and trader. He produces corporate and financial newsletters, and assists clients in getting published in the mainstream media. He is the host of TradeSystemGuru.com. Matt has earned the Chartered Market Technician (CMT) designation. Find out what stocks and futures Matt is watching on Twitter at www.twitter.com/RatioTrade
PRINT THIS ARTICLE
REVERSAL
Is October The Season For 3-D Printers?
10/14/13 05:09:41 PMby Matt Blackman
Like much of the market, 3D stocks took a hit leading up to the budget feud on Capital Hill. But, for traders, there is an interesting seasonal pattern that could present itself when the feud ends.
Position: N/A
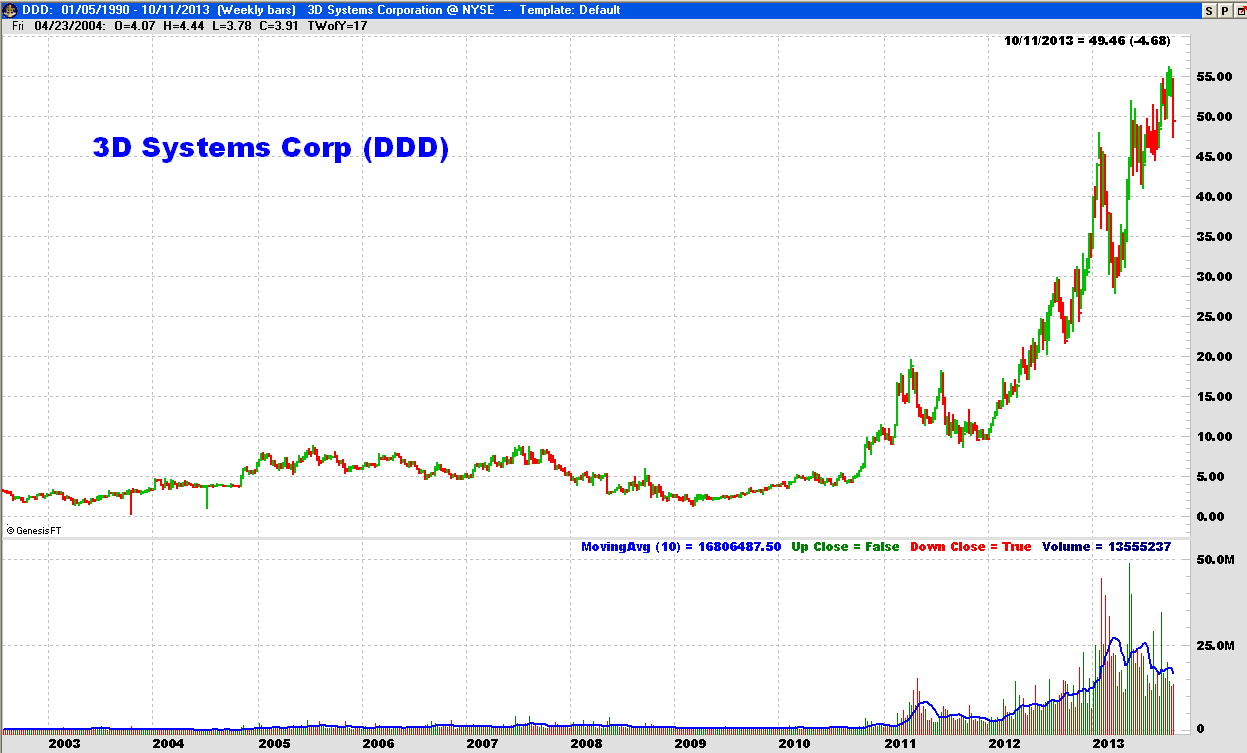
| In a February 2013 article entitled "3D Printing Stocks: What Does This Parabolic Blowoff Mean?", I discussed the incredible growth in two 3D printing companies and their subsequent drop in price. But after experiencing a moderate correction, the sector resumed its parabolic move. Three dimensional printers may have been around for 25 years, but only recently did the technology catch the attention of investors. Two companies in the space, 3D Systems Corporation (DDD) (Figure 1) and Stratasys Inc. (SSYS) have performed especially well in the last three years — the former increasing in price by more than 3300% since early 2009. |

|
| Figure 1. Weekly chart of 3D Systems Corp. showing growth in the last decade with the parabolic run that began in 2010. |
| Graphic provided by: www.GenesisFT.com. |
| |
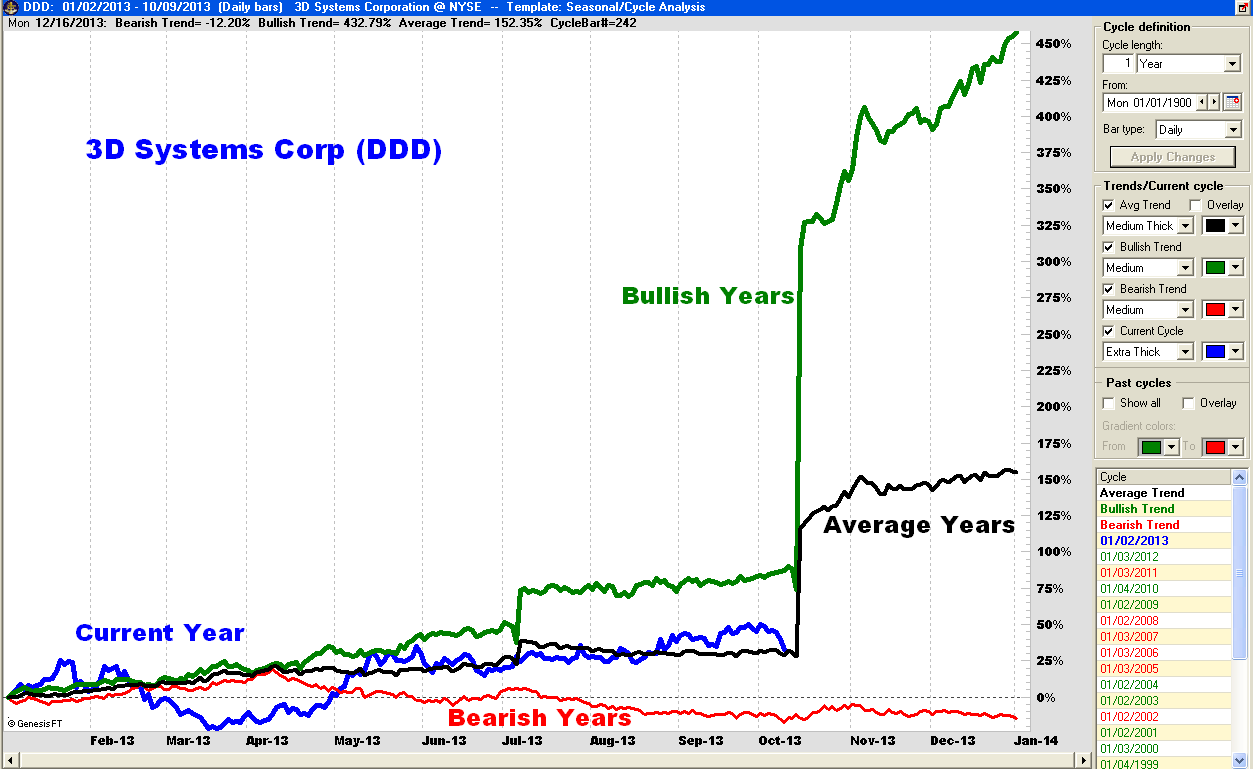
| So why is this technology important? It offers the promise of making items locally that are now manufactured in faraway places like China, Vietnam, and India where labor costs are lower. It offers special promise to industries such as the medical devices industry. Devices such as heart stents and other surgical implants could be printed right in the hospitals when they are needed. However, any parabolic move should inspire caution in even the most aggressive trader. But when the correction that began in the fall of 2013 ends, it might also provide an interesting opportunity. As Figure 2 showing the composite performance of 3D Systems indicates, October has traditionally been a good month for the stock over its 14 year history, especially in up years. So far 2013 has been positive for the stock, which has performed close to its long-term average. |

|
| Figure 2. Seasonal chart of 3D Systems showing the composite performance of the stock in average years (black), bullish years (green) and bearish years (red). The blue line shows the relative performance of the stock in 2013. |
| Graphic provided by: www.GenesisFT.com. |
| |
| Fundamentally, 3D Systems is certainly not cheap — it has a PE ratio north of 80 times earnings. But that metric still pales in comparison to stocks like Facebook with a PE of 212 or Netflix with a 384 PE. The good news is that earnings are up 32% in the last year and the five-year sales growth rate is 24%. As well, nearly 60% of the shares are owned by institutions. But more importantly, especially in this kind of market, are the technical trading opportunities. If we get a bottom in stocks in October or November, DDD could generate a tradable rebound if historical performance is any guide. |
Matt Blackman is a full-time technical and financial writer and trader. He produces corporate and financial newsletters, and assists clients in getting published in the mainstream media. He is the host of TradeSystemGuru.com. Matt has earned the Chartered Market Technician (CMT) designation. Find out what stocks and futures Matt is watching on Twitter at www.twitter.com/RatioTrade
| Company: | TradeSystemGuru.com |
| Address: | Box 2589 |
| Garibaldi Highlands, BC Canada | |
| Phone # for sales: | 604-898-9069 |
| Fax: | 604-898-9069 |
| Website: | www.tradesystemguru.com |
| E-mail address: | indextradermb@gmail.com |
Traders' Resource Links | |
| TradeSystemGuru.com has not added any product or service information to TRADERS' RESOURCE. | |
Click here for more information about our publications!
PRINT THIS ARTICLE

Request Information From Our Sponsors
- VectorVest, Inc.
- Executive Premier Workshop
- One-Day Options Course
- OptionsPro
- Retirement Income Workshop
- Sure-Fire Trading Systems (VectorVest, Inc.)
- Trading as a Business Workshop
- VectorVest 7 EOD
- VectorVest 7 RealTime/IntraDay
- VectorVest AutoTester
- VectorVest Educational Services
- VectorVest OnLine
- VectorVest Options Analyzer
- VectorVest ProGraphics v6.0
- VectorVest ProTrader 7
- VectorVest RealTime Derby Tool
- VectorVest Simulator
- VectorVest Variator
- VectorVest Watchdog
- StockCharts.com, Inc.
- Candle Patterns
- Candlestick Charting Explained
- Intermarket Technical Analysis
- John Murphy on Chart Analysis
- John Murphy's Chart Pattern Recognition
- John Murphy's Market Message
- MurphyExplainsMarketAnalysis-Intermarket Analysis
- MurphyExplainsMarketAnalysis-Visual Analysis
- StockCharts.com
- Technical Analysis of the Financial Markets
- The Visual Investor
