HOT TOPICS LIST
- MACD
- Fibonacci
- RSI
- Gann
- ADXR
- Stochastics
- Volume
- Triangles
- Futures
- Cycles
- Volatility
- ZIGZAG
- MESA
- Retracement
- Aroon
INDICATORS LIST
LIST OF TOPICS
PRINT THIS ARTICLE
by Matt Blackman
With January market weakness, a number of leading stocks look to be exhibiting topping chart patterns. Here's another one. What does it mean?
Position: N/A
Matt Blackman
Matt Blackman is a full-time technical and financial writer and trader. He produces corporate and financial newsletters, and assists clients in getting published in the mainstream media. He is the host of TradeSystemGuru.com. Matt has earned the Chartered Market Technician (CMT) designation. Find out what stocks and futures Matt is watching on Twitter at www.twitter.com/RatioTrade
PRINT THIS ARTICLE
HEAD & SHOULDERS
Amazon Also Looking Toppy...
02/03/14 03:30:22 PMby Matt Blackman
With January market weakness, a number of leading stocks look to be exhibiting topping chart patterns. Here's another one. What does it mean?
Position: N/A
| In my last article entitled, "Is A Google Reversal At Hand?", we examined the bearish Frozen Rope pattern that was flashing on its stock chart. If this is a sign of a reversal in market-leading stocks, others should be showing signs of weakness as well. This is exactly what we were seeing on Amazon (AMZN) toward the end of January 2014. Since bottoming in 2009, AMZN had increased tenfold and was in need of a rest. But was it the start of a major reversal? |

|
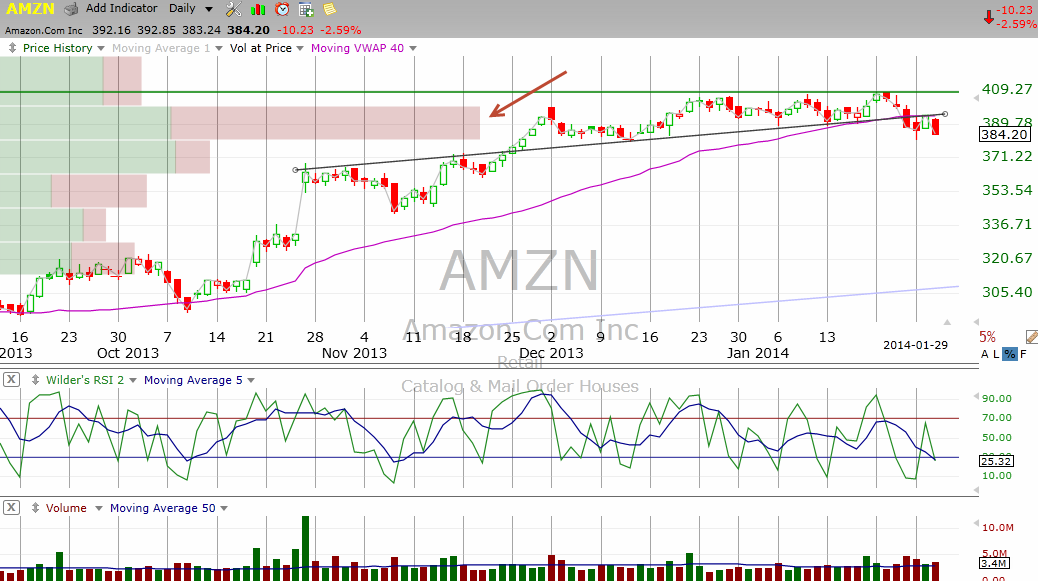
| Figure 1 – Daily chart of Amazon showing the shallow Head & Shoulders (or Triple Top?) pattern after the stock broke below neckline support (black line) as well as the 40-day Volume Weighted Average Price (magenta line). |
| Graphic provided by: TC2000.com. |
| |
| As we see in Figure 1, AMZN had just confirmed a shallow head & shoulders pattern as price broke below the neckline (up-sloping black line). That line was also breached on above average volume. Note that the failed attempt to break above the neckline two days later (January 28) was on lower volume, which is bearish, and the next day the stock again dropped on above average volume. Finally, note that volume-at-price shows that the stock had dropped below volume support which then became resistance (dark red arrow). |
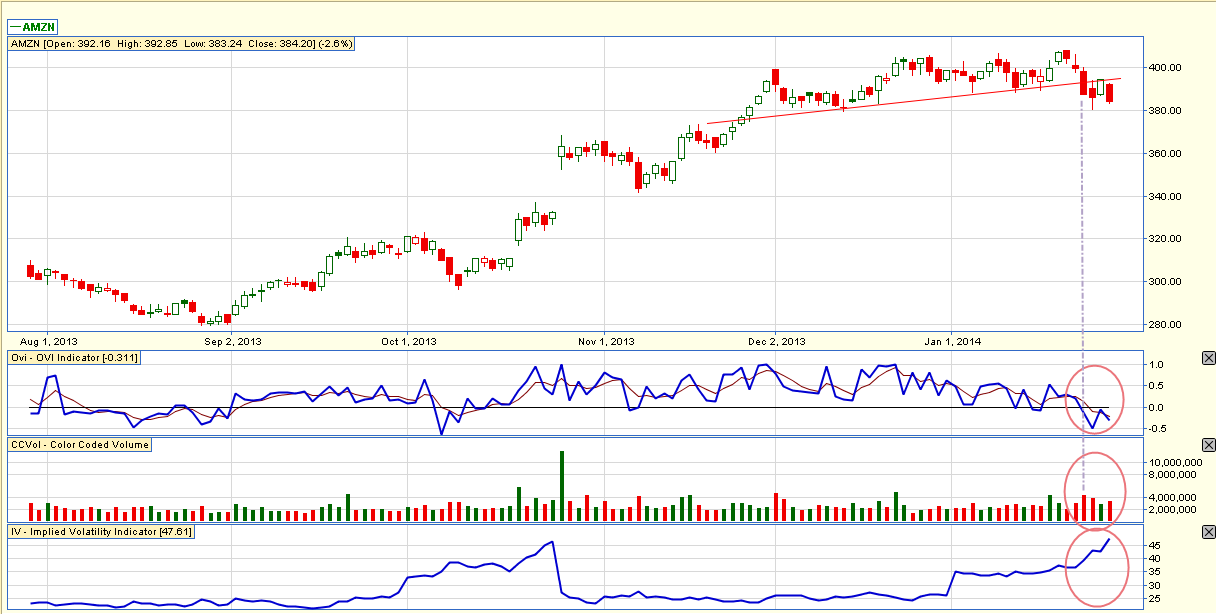
| In Figure 2 we see the stock chart from an options trader's point of view. On January 24, when the neckline was breached, the OVI indicator (see www.OVIIndex.com) showed that options traders were getting increasingly bearish as the line dropped below zero. Two (trading) days later on January 28, 2014 the OVI attempted to break back above the zero line but failed. |

|
| Figure 2 – Chart showing Amazon together with options indicators. Note that the OVI, which provides an insight into options trades, breaches the zero line, rises to test it the next day but fails and turns south again on January 29. |
| Graphic provided by: www.OVIindex.com. |
| |
| Finally, note the rise in implied volatility (bottom sub-graph in Figure 2) often warns of a trend reversal under way. |
| Patterns like the ones we are seeing in Google (GOOG) and Amazon indicate an overall weakening in stock markets. But only time will tell if they are showing a temporary correction in the uptrend or a more serious trend reversal. |
Matt Blackman is a full-time technical and financial writer and trader. He produces corporate and financial newsletters, and assists clients in getting published in the mainstream media. He is the host of TradeSystemGuru.com. Matt has earned the Chartered Market Technician (CMT) designation. Find out what stocks and futures Matt is watching on Twitter at www.twitter.com/RatioTrade
| Company: | TradeSystemGuru.com |
| Address: | Box 2589 |
| Garibaldi Highlands, BC Canada | |
| Phone # for sales: | 604-898-9069 |
| Fax: | 604-898-9069 |
| Website: | www.tradesystemguru.com |
| E-mail address: | indextradermb@gmail.com |
Traders' Resource Links | |
| TradeSystemGuru.com has not added any product or service information to TRADERS' RESOURCE. | |
Click here for more information about our publications!
Comments

|

Request Information From Our Sponsors
- StockCharts.com, Inc.
- Candle Patterns
- Candlestick Charting Explained
- Intermarket Technical Analysis
- John Murphy on Chart Analysis
- John Murphy's Chart Pattern Recognition
- John Murphy's Market Message
- MurphyExplainsMarketAnalysis-Intermarket Analysis
- MurphyExplainsMarketAnalysis-Visual Analysis
- StockCharts.com
- Technical Analysis of the Financial Markets
- The Visual Investor
- VectorVest, Inc.
- Executive Premier Workshop
- One-Day Options Course
- OptionsPro
- Retirement Income Workshop
- Sure-Fire Trading Systems (VectorVest, Inc.)
- Trading as a Business Workshop
- VectorVest 7 EOD
- VectorVest 7 RealTime/IntraDay
- VectorVest AutoTester
- VectorVest Educational Services
- VectorVest OnLine
- VectorVest Options Analyzer
- VectorVest ProGraphics v6.0
- VectorVest ProTrader 7
- VectorVest RealTime Derby Tool
- VectorVest Simulator
- VectorVest Variator
- VectorVest Watchdog
