

HOT TOPICS LIST
- MACD
- Fibonacci
- RSI
- Gann
- ADXR
- Stochastics
- Volume
- Triangles
- Futures
- Cycles
- Volatility
- ZIGZAG
- MESA
- Retracement
- Aroon
INDICATORS LIST
LIST OF TOPICS
PRINT THIS ARTICLE
by Matt Blackman
It's been a great run for GOOG since it went public nearly ten years ago. In November 2013, it officially became a 10-bagger. Is there a big correction in the cards for the stock?
Position: N/A
Matt Blackman
Matt Blackman is a full-time technical and financial writer and trader. He produces corporate and financial newsletters, and assists clients in getting published in the mainstream media. He is the host of TradeSystemGuru.com. Matt has earned the Chartered Market Technician (CMT) designation. Find out what stocks and futures Matt is watching on Twitter at www.twitter.com/RatioTrade
PRINT THIS ARTICLE
BULL/BEAR MARKET
Is A Google Reversal At Hand?
01/31/14 04:47:57 PMby Matt Blackman
It's been a great run for GOOG since it went public nearly ten years ago. In November 2013, it officially became a 10-bagger. Is there a big correction in the cards for the stock?
Position: N/A
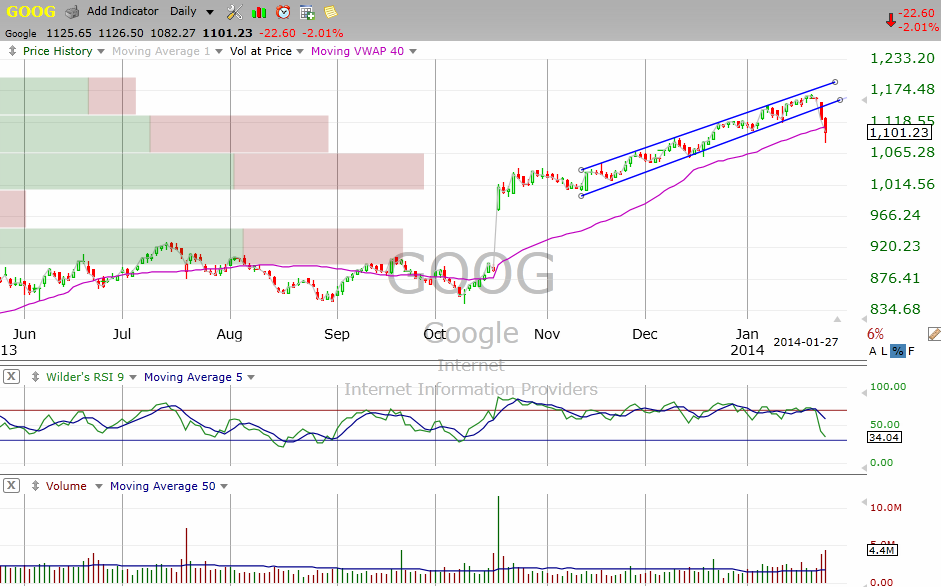
| In January 2014, as the rest of the stock market floundered, Google (GOOG) continued to power higher, bound in the narrow channel that the stock began building in mid-November 2013. Normally up-sloping channels are good — the trader buys when the stock hits the bottom (support) and sells when it hits the top (resistance) channel and keeps trading the channel for as long as it lasts. But one type of up-sloping channel is bearish, which stock trader and host of ChartPattern.com Dan Zanger labeled the Frozen Rope. According to Zanger, the Frozen Rope is a channel formed by a stock that moves up in an orderly fashion, too orderly as it turns out, on a 45 (or so) degree angle. It eventually ends and "more often than not these ropes lead to a move lower," he says. In general, the steeper the channel, the more bearish the pattern. |
|
| Figure 1 � Daily chart of Google showing the Frozen Rope pattern beginning in mid-November which was breached January 24, 2014. On Monday, January 27 the stock also pierced the 40-day Volume-Weighted Average Price (VWAP). |
| Graphic provided by: TC2000.com. |
| |
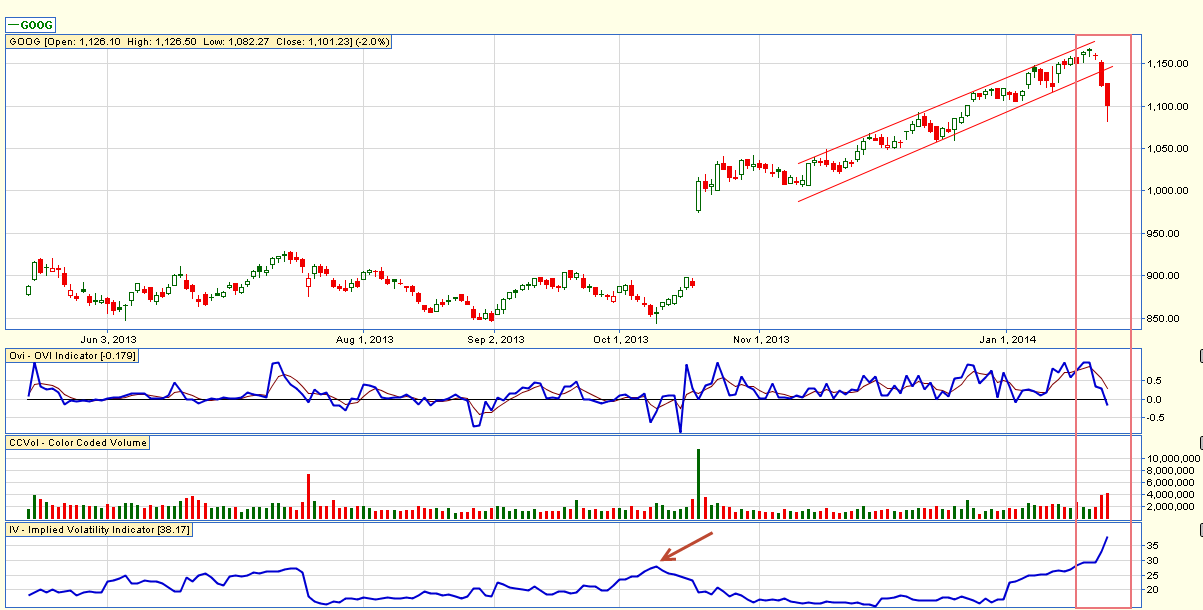
| Figure 2 shows another view of the Frozen Rope pattern on GOOG together with two option indicators — Options Implied Volatility and the OVI indicator which shows whether options traders are making bullish or bearish bets. As we see, the channel breach on January 24 followed an increase in implied volatility and then an OVI break below zero as traders turned increasingly bearish. |
|
| Figure 2 � Daily chart of Google showing the options Implied Volatility in the lower sub-graph and the OVI indicator which shows what options traders are doing. When the OVI line drops below zero, it indicates that options traders have turned bearish. Note the rising volatility at the far right-hand side of the chart indicating a possible change in trend. |
| Graphic provided by: www.OVIIndex.com. |
| |
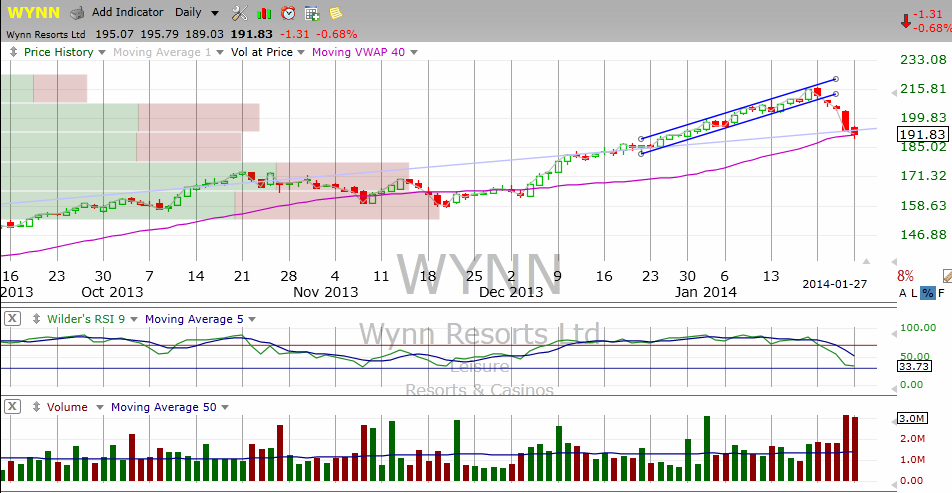
| Wynn Resorts (Figure 3), which Zanger warned his newsletter subscribers on Monday January 20th was in the process of putting in a Frozen Rope pattern, "that always lead to lower prices when broken." Two days later the pattern was decisively broken to the downside. |
|
| Figure 3 � Daily chart of Wynn Resorts showing the Frozen Rope that Dan Zanger warned his subscribers about in his January 20 ChartPattern.com newsletter and subsequent breach two days later. |
| Graphic provided by: TC2000.com. |
| |
| Does the Frozen Rope in Google or Wynn mean that these stocks are in the process of making major trend reversals or just temporary corrections on the way to higher prices? There is no way of knowing for sure until after the fact. But if a major trend change is underway, we should expect to see a lot more reversal patterns like the Frozen Rope either formed or in the process of forming on U.S. stocks. |
Matt Blackman is a full-time technical and financial writer and trader. He produces corporate and financial newsletters, and assists clients in getting published in the mainstream media. He is the host of TradeSystemGuru.com. Matt has earned the Chartered Market Technician (CMT) designation. Find out what stocks and futures Matt is watching on Twitter at www.twitter.com/RatioTrade
| Company: | TradeSystemGuru.com |
| Address: | Box 2589 |
| Garibaldi Highlands, BC Canada | |
| Phone # for sales: | 604-898-9069 |
| Fax: | 604-898-9069 |
| Website: | www.tradesystemguru.com |
| E-mail address: | indextradermb@gmail.com |
Traders' Resource Links | |
| TradeSystemGuru.com has not added any product or service information to TRADERS' RESOURCE. | |
Click here for more information about our publications!
PRINT THIS ARTICLE

Request Information From Our Sponsors
- VectorVest, Inc.
- Executive Premier Workshop
- One-Day Options Course
- OptionsPro
- Retirement Income Workshop
- Sure-Fire Trading Systems (VectorVest, Inc.)
- Trading as a Business Workshop
- VectorVest 7 EOD
- VectorVest 7 RealTime/IntraDay
- VectorVest AutoTester
- VectorVest Educational Services
- VectorVest OnLine
- VectorVest Options Analyzer
- VectorVest ProGraphics v6.0
- VectorVest ProTrader 7
- VectorVest RealTime Derby Tool
- VectorVest Simulator
- VectorVest Variator
- VectorVest Watchdog
- StockCharts.com, Inc.
- Candle Patterns
- Candlestick Charting Explained
- Intermarket Technical Analysis
- John Murphy on Chart Analysis
- John Murphy's Chart Pattern Recognition
- John Murphy's Market Message
- MurphyExplainsMarketAnalysis-Intermarket Analysis
- MurphyExplainsMarketAnalysis-Visual Analysis
- StockCharts.com
- Technical Analysis of the Financial Markets
- The Visual Investor