

HOT TOPICS LIST
- MACD
- Fibonacci
- RSI
- Gann
- ADXR
- Stochastics
- Volume
- Triangles
- Futures
- Cycles
- Volatility
- ZIGZAG
- MESA
- Retracement
- Aroon
INDICATORS LIST
LIST OF TOPICS
PRINT THIS ARTICLE
by Matt Blackman
Apple has made an enviable recovery since its breakdown in September 2012. But what impact has January weakness had on the stock?
Position: N/A
Matt Blackman
Matt Blackman is a full-time technical and financial writer and trader. He produces corporate and financial newsletters, and assists clients in getting published in the mainstream media. He is the host of TradeSystemGuru.com. Matt has earned the Chartered Market Technician (CMT) designation. Find out what stocks and futures Matt is watching on Twitter at www.twitter.com/RatioTrade
PRINT THIS ARTICLE
BULL/BEAR MARKET
Apple Cup & Handle Update
01/27/14 04:49:41 PMby Matt Blackman
Apple has made an enviable recovery since its breakdown in September 2012. But what impact has January weakness had on the stock?
Position: N/A
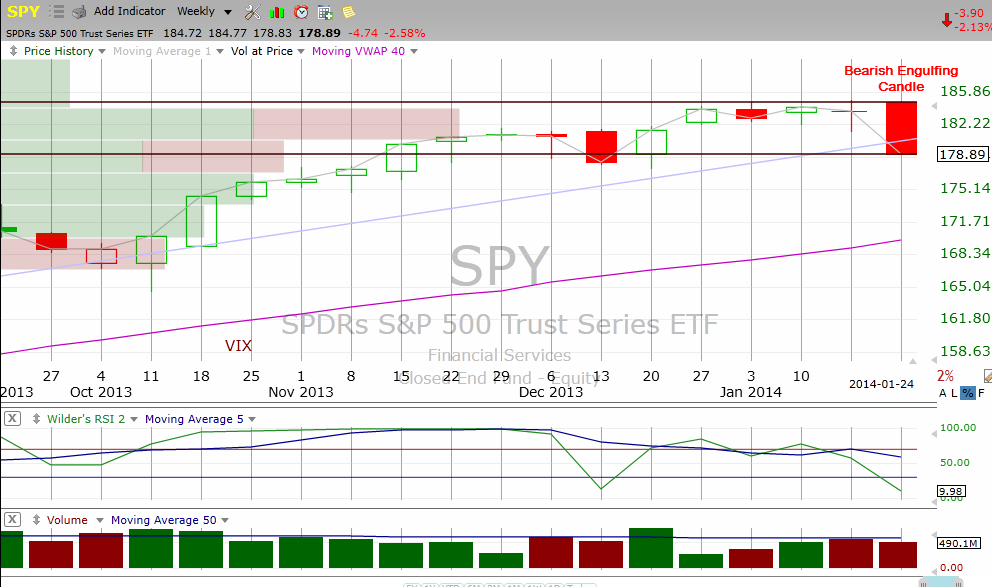
| As far as weeks go for the stock market, January 20-24, 2014 was the ugliest in recent memory. The week generated a bearish engulfing candle on the SPDRs S&P500 Trust Series ETF (SPY) that 'engulfed' the prior four weeks (and came very close to engulfing the prior five). This action has made it necessary to re-examine any trading plan, especially when trades to the long side are involved. In the wake of this action it was necessary to re-examine the trade discussed in "Apple Building a Bullish Chart Pattern". As we see from Figures 2 and 3, the bullish take remained intact as of January 24, 2014. As the article pointed out, this is typically a bullish seasonal period for AAPL and the bullish pattern confirms the point. |
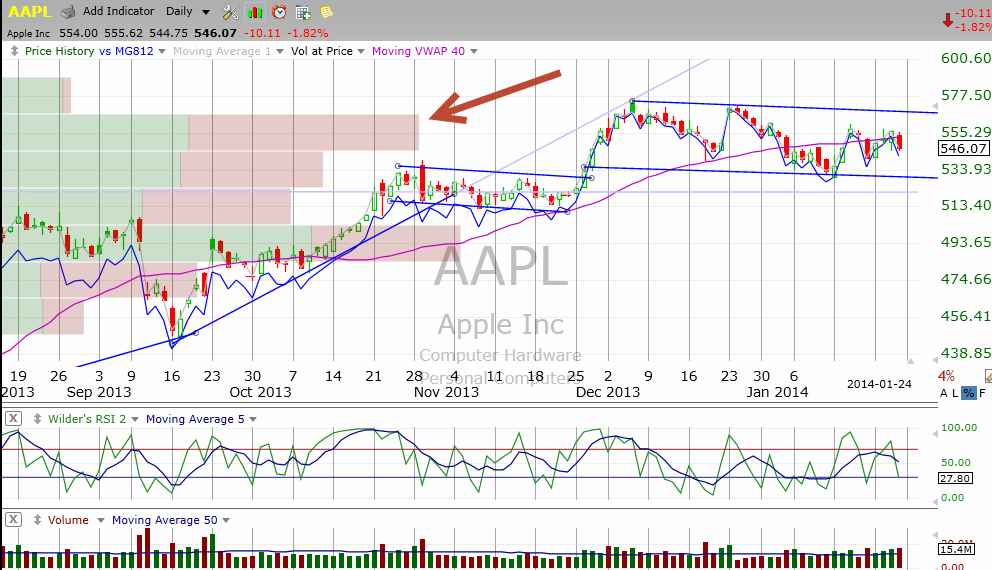
| As Figure 2 shows, AAPL remains contained in its latest handle of a larger cup & handle pattern with the latest action just below volume-at-price resistance (see red arrow). As long as the stock remains bound by the upper and lower handle support/resistance lines, a buy signal would be triggered by a decisive breakout to the upside on above average buying volume. |
|
| Figure 1 � Weekly chart of the SPDRs S&P500 Trust Series ETF (SPY) showing the ugly bearish engulfing candle for the week of January 24, 2014. The fact that weekly volume was below average and below the prior week�s volume is mildly bullish. The same pattern occurred on the SPDRs Dow Jones Industrial Average ETF (DIA) except that pattern was accompanied by above average selling volume. It�s worth noting that the last time the DIA posted a bearish engulfing candle encompassing four weeks or more (also on above average volume) was during the week of July 27, 2007. |
| Graphic provided by: TC2000.com. |
| |
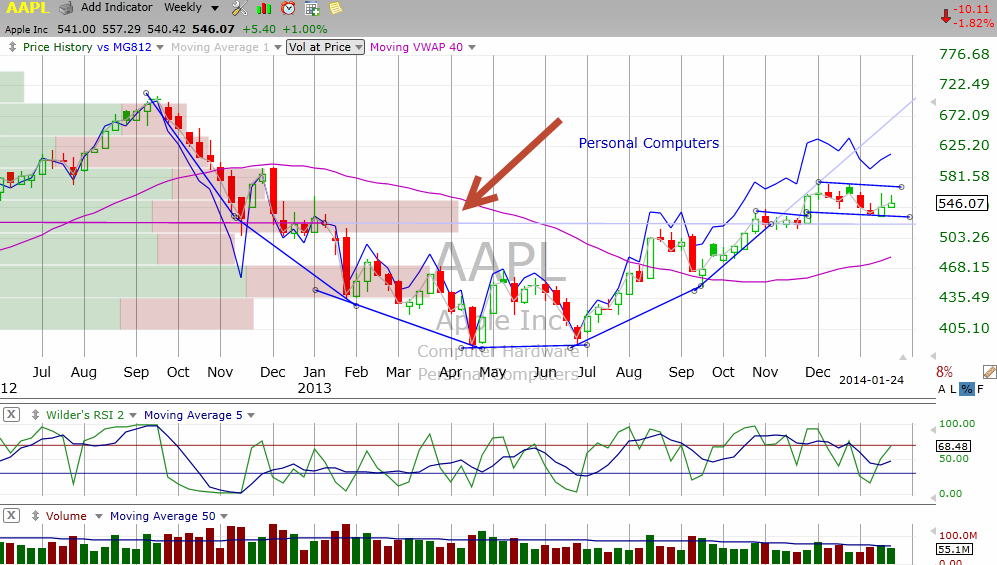
| The weekly chart looks even more bullish from the standpoint of volume-at-price showing that volume is support (not resistance as in the daily chart). |
|
| Figure 2 � Daily chart of AAPL showing the latest Handle of the bullish Cup & Handle pattern visible on the weekly chart below. Note that the stock is just below volume resistance (see red arrow). |
| Graphic provided by: TC2000.com. |
| |
| So unless the current market depression develops into a full blown storm accompanied by more sizable down days on increasing selling volume and an AAPL break below handle support, the outlook for the stock remains bullish. |
|
| Figure 3 � Weekly chart showing Cup & Handle pattern with volume support. |
| Graphic provided by: TC2000.com. |
| |
Matt Blackman is a full-time technical and financial writer and trader. He produces corporate and financial newsletters, and assists clients in getting published in the mainstream media. He is the host of TradeSystemGuru.com. Matt has earned the Chartered Market Technician (CMT) designation. Find out what stocks and futures Matt is watching on Twitter at www.twitter.com/RatioTrade
| Company: | TradeSystemGuru.com |
| Address: | Box 2589 |
| Garibaldi Highlands, BC Canada | |
| Phone # for sales: | 604-898-9069 |
| Fax: | 604-898-9069 |
| Website: | www.tradesystemguru.com |
| E-mail address: | indextradermb@gmail.com |
Traders' Resource Links | |
| TradeSystemGuru.com has not added any product or service information to TRADERS' RESOURCE. | |
Click here for more information about our publications!
Comments

Request Information From Our Sponsors
- VectorVest, Inc.
- Executive Premier Workshop
- One-Day Options Course
- OptionsPro
- Retirement Income Workshop
- Sure-Fire Trading Systems (VectorVest, Inc.)
- Trading as a Business Workshop
- VectorVest 7 EOD
- VectorVest 7 RealTime/IntraDay
- VectorVest AutoTester
- VectorVest Educational Services
- VectorVest OnLine
- VectorVest Options Analyzer
- VectorVest ProGraphics v6.0
- VectorVest ProTrader 7
- VectorVest RealTime Derby Tool
- VectorVest Simulator
- VectorVest Variator
- VectorVest Watchdog
- StockCharts.com, Inc.
- Candle Patterns
- Candlestick Charting Explained
- Intermarket Technical Analysis
- John Murphy on Chart Analysis
- John Murphy's Chart Pattern Recognition
- John Murphy's Market Message
- MurphyExplainsMarketAnalysis-Intermarket Analysis
- MurphyExplainsMarketAnalysis-Visual Analysis
- StockCharts.com
- Technical Analysis of the Financial Markets
- The Visual Investor