

HOT TOPICS LIST
- MACD
- Fibonacci
- RSI
- Gann
- ADXR
- Stochastics
- Volume
- Triangles
- Futures
- Cycles
- Volatility
- ZIGZAG
- MESA
- Retracement
- Aroon
INDICATORS LIST
LIST OF TOPICS
PRINT THIS ARTICLE
by Matt Blackman
Since bottoming around $390 range in mid-2013, Apple Inc. has posted an admirable rally. Look what the stock is doing now.
Position: N/A
Matt Blackman
Matt Blackman is a full-time technical and financial writer and trader. He produces corporate and financial newsletters, and assists clients in getting published in the mainstream media. He is the host of TradeSystemGuru.com. Matt has earned the Chartered Market Technician (CMT) designation. Find out what stocks and futures Matt is watching on Twitter at www.twitter.com/RatioTrade
PRINT THIS ARTICLE
CUP WITH HANDLE
Apple Building Bullish Chart Pattern
01/20/14 01:43:01 PMby Matt Blackman
Since bottoming around $390 range in mid-2013, Apple Inc. has posted an admirable rally. Look what the stock is doing now.
Position: N/A
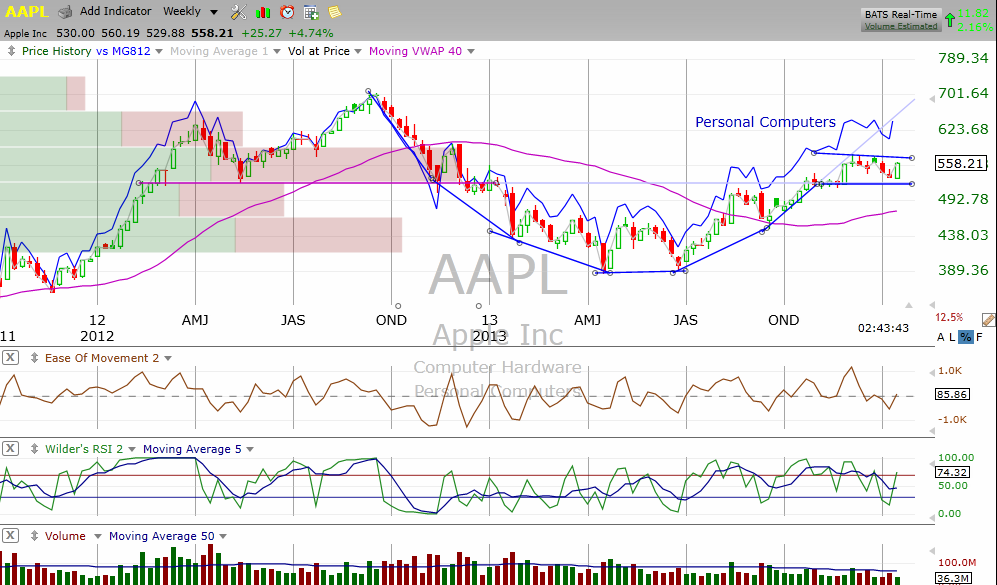
| If you bought Apple (AAPL) after it hit bottom around $390 for the second time in July 2013, you were up more than 40% by year-end. And if the latest bullish chart pattern is any indication, it looks like there is a good deal more upside to come. Apple put in an all-time high just north of $700 in September 2012 only to see its stock price nearly cut in half over the ensuing eight months but the comeback helped build the left side of a bullish cup & handle chart pattern that is now building an elongated handle between $510 and $565 (Figure 1). |
|
| Figure 1 � Daily chart showing the Cup & Handle formation in its final stages as of mid-January 2014. Personal Computers are also trending higher which should add further fuel to the rally. |
| Graphic provided by: TC2000.com. |
| |
| So what target price does the pattern imply? According to Tom Bulkowski, author of the essential reference "Encyclopedia of Chart Patterns," the target is arrived at by subtracting the top of the handle from the bottom of the cup and adding the result to the top of the handle. Rounding off both numbers, and adding the result to the top of the handle at $565 generates a target of $745 which would take the stock to a new all-time high. This target assumes that the tech rally continues to unfold well into 2014. |
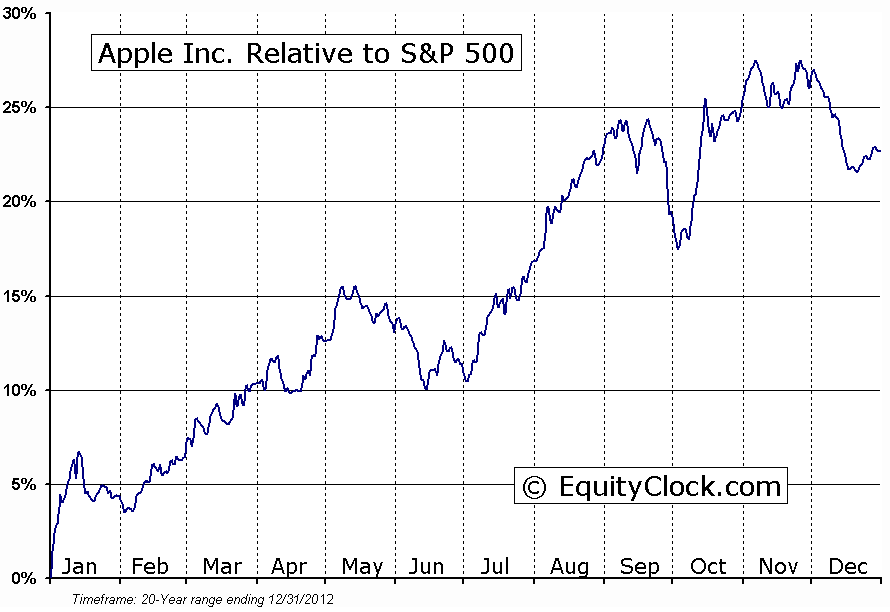
| What other factors add confirmation to this forecast? As Figure 2 shows, seasonality for AAPL has been positive into May over the past 20 years when the stock handily outperformed the S&P500. |
|
| Figure 2 � Seasonal performance of AAPL relative to the S&P500 Index courtesy of EquityClock.com |
| Graphic provided by: EquityClock.com. |
| |
| As a caveat, it's important to note that in his research, Bulkowski found that bullish cup & handles were about middle of the road for performance, earning a pattern ranking of 13 out of 23 with 1 being the highest ranking. He found that 50% of the bullish patterns met their price targets. |
| Cup & Handle trades are typically entered when the stock breaks above top handle resistance ideally on greater than average volume. Suggested Reading: Bulkowski, Thomas N. (2005), Encyclopedia of Chart Patterns, (Wiley & Sons) http://goo.gl/gmdmgP |
Matt Blackman is a full-time technical and financial writer and trader. He produces corporate and financial newsletters, and assists clients in getting published in the mainstream media. He is the host of TradeSystemGuru.com. Matt has earned the Chartered Market Technician (CMT) designation. Find out what stocks and futures Matt is watching on Twitter at www.twitter.com/RatioTrade
| Company: | TradeSystemGuru.com |
| Address: | Box 2589 |
| Garibaldi Highlands, BC Canada | |
| Phone # for sales: | 604-898-9069 |
| Fax: | 604-898-9069 |
| Website: | www.tradesystemguru.com |
| E-mail address: | indextradermb@gmail.com |
Traders' Resource Links | |
| TradeSystemGuru.com has not added any product or service information to TRADERS' RESOURCE. | |
Click here for more information about our publications!
Comments

Request Information From Our Sponsors
- StockCharts.com, Inc.
- Candle Patterns
- Candlestick Charting Explained
- Intermarket Technical Analysis
- John Murphy on Chart Analysis
- John Murphy's Chart Pattern Recognition
- John Murphy's Market Message
- MurphyExplainsMarketAnalysis-Intermarket Analysis
- MurphyExplainsMarketAnalysis-Visual Analysis
- StockCharts.com
- Technical Analysis of the Financial Markets
- The Visual Investor
- VectorVest, Inc.
- Executive Premier Workshop
- One-Day Options Course
- OptionsPro
- Retirement Income Workshop
- Sure-Fire Trading Systems (VectorVest, Inc.)
- Trading as a Business Workshop
- VectorVest 7 EOD
- VectorVest 7 RealTime/IntraDay
- VectorVest AutoTester
- VectorVest Educational Services
- VectorVest OnLine
- VectorVest Options Analyzer
- VectorVest ProGraphics v6.0
- VectorVest ProTrader 7
- VectorVest RealTime Derby Tool
- VectorVest Simulator
- VectorVest Variator
- VectorVest Watchdog