HOT TOPICS LIST
- MACD
- Fibonacci
- RSI
- Gann
- ADXR
- Stochastics
- Volume
- Triangles
- Futures
- Cycles
- Volatility
- ZIGZAG
- MESA
- Retracement
- Aroon
INDICATORS LIST
LIST OF TOPICS
PRINT THIS ARTICLE
by Andrew Hetherington
It is unfortunate for this e-retailer that the expected rebound has come to an end. Amazon.com has bounced up from the $5.51 low of last September to a very respectable and surprising high in May of $20.40.
Position: N/A
Andrew Hetherington
Classic Dow Theorist who trades as a pure technician, using pattern recognition.
PRINT THIS ARTICLE
CHART ANALYSIS
It's Time To Exit Amazon.com
10/04/02 01:26:04 PMby Andrew Hetherington
It is unfortunate for this e-retailer that the expected rebound has come to an end. Amazon.com has bounced up from the $5.51 low of last September to a very respectable and surprising high in May of $20.40.
Position: N/A
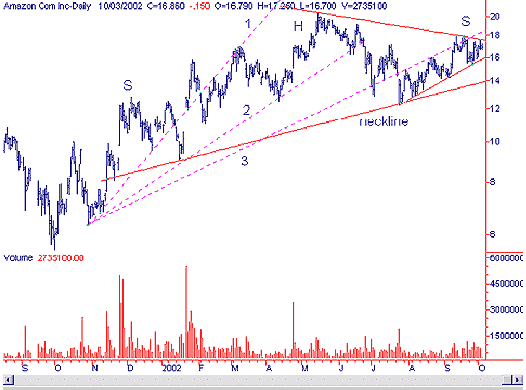
 Figure 1: Amazon.com daily chart. In Figure 1 there is an 11-month head and shoulders pattern that is almost completed. It is currently finishing the right shoulder. This is the point where I prefer to take my short position, at the top of the right shoulder. This head and shoulders top reversal pattern has good volume on the patterns creation diminishing from the left to the right side. The third fan line was broken in July and it is crawling along below the fan line in a trend channel. The second half of the head and shoulders pattern looks like a symmetrical triangle, as is customary. The top line on the channel and the symmetrical triangle are in the $17.50-$18.00 area and this is the optimum shorting position. Confirmation of the upcoming breakdown will come when it drops below this channel in the $16.00 area. The upsloping neckline is in the $14.00 area and this will be the breakout from the head and shoulders pattern. |

|
| Figure 2: Amazon.com weekly chart. |
| Graphic provided by: SuperCharts. |
| |
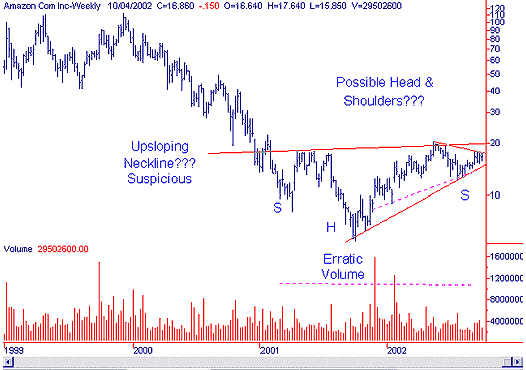
| Figure 2 shows a weekly chart with the appearance of a large 2-year head and shoulders bottom reversal pattern. Unfortunately, this pattern does not exist since the volume half of the equation doesn't match the pattern. I've illustrated this weekly chart to warn of the pitfalls of trading within the pattern. If you are trading within the pattern that has not broken out yet, you must be absolutely sure that it will break in the direction you are anticipating. Some believe this head and shoulders will break out topside. However, if you examine the fan lines and the volume and take into consideration the general market trend being down, then you must conclude there will be a downward move. If I were holding this equity in a long position, I would sell into the strength in this area and trade it short. My expectations are that this equity will eventually reach $10.00 on this run down and perhaps go even lower towards the September low if the market continues downward as I expect it will. |
Classic Dow Theorist who trades as a pure technician, using pattern recognition.
| Toronto, Canada |
Click here for more information about our publications!
Comments
Date: 10/08/02Rank: 5Comment:
Date: 10/08/02Rank: 4Comment:
Date: 10/11/02Rank: 5Comment:

|

Request Information From Our Sponsors
- StockCharts.com, Inc.
- Candle Patterns
- Candlestick Charting Explained
- Intermarket Technical Analysis
- John Murphy on Chart Analysis
- John Murphy's Chart Pattern Recognition
- John Murphy's Market Message
- MurphyExplainsMarketAnalysis-Intermarket Analysis
- MurphyExplainsMarketAnalysis-Visual Analysis
- StockCharts.com
- Technical Analysis of the Financial Markets
- The Visual Investor
- VectorVest, Inc.
- Executive Premier Workshop
- One-Day Options Course
- OptionsPro
- Retirement Income Workshop
- Sure-Fire Trading Systems (VectorVest, Inc.)
- Trading as a Business Workshop
- VectorVest 7 EOD
- VectorVest 7 RealTime/IntraDay
- VectorVest AutoTester
- VectorVest Educational Services
- VectorVest OnLine
- VectorVest Options Analyzer
- VectorVest ProGraphics v6.0
- VectorVest ProTrader 7
- VectorVest RealTime Derby Tool
- VectorVest Simulator
- VectorVest Variator
- VectorVest Watchdog
