

HOT TOPICS LIST
- MACD
- Fibonacci
- RSI
- Gann
- ADXR
- Stochastics
- Volume
- Triangles
- Futures
- Cycles
- Volatility
- ZIGZAG
- MESA
- Retracement
- Aroon
INDICATORS LIST
LIST OF TOPICS
PRINT THIS ARTICLE
by Matt Blackman
Year-end has historically been a good time to own gold thanks to seasonal jewelry demand. So what happened in 2013?
Position: N/A
Matt Blackman
Matt Blackman is a full-time technical and financial writer and trader. He produces corporate and financial newsletters, and assists clients in getting published in the mainstream media. He is the host of TradeSystemGuru.com. Matt has earned the Chartered Market Technician (CMT) designation. Find out what stocks and futures Matt is watching on Twitter at www.twitter.com/RatioTrade
PRINT THIS ARTICLE
SUPPORT & RESISTANCE
What Happened To The Golden Season?
12/31/13 04:38:35 PMby Matt Blackman
Year-end has historically been a good time to own gold thanks to seasonal jewelry demand. So what happened in 2013?
Position: N/A
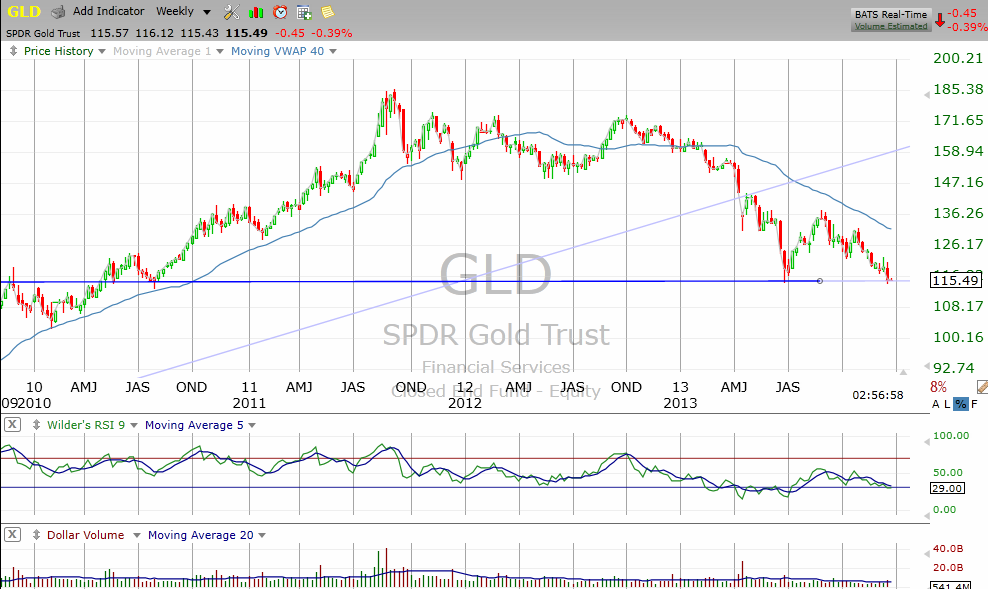
| The week of December 16, 2013 was a good one for US stocks. A bearish head & shoulders (H&S) pattern was decisively invalidated as investors launched the Santa Claus rally, which typically occurs in the last five trading days of the old year and first two days of the new, a few days early. But the celebration seems to have missed precious metals. As we see from Figure 1 of the SPDR Gold Trust ETF GLD, gold was struggling to keep its head above major support around 115.20. |
|
| Figure 1 � Weekly chart of the GLD ETF showing the peak in September 2011 then the almost steady decline through year-end 2013 with the stock hovering just above support. |
| Graphic provided by: TC2000.com. |
| |
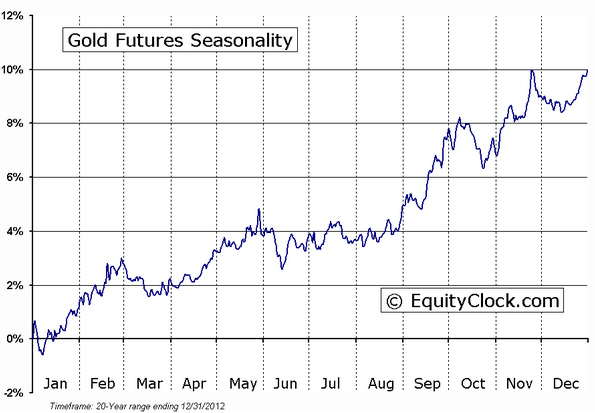
| This season is usually a good time to own gold as we see from the 20-year composite gold chart in Figure 2. On average gold has increased 6% between September 1 and December 31 driven in large part by year-end gold demand for products like gold jewelry and coins. |
|
| Figure 2 � Seasonal composite for the gold commodity showing typical strength in the last four months of the year. |
| Graphic provided by: www.EquityClock.com. |
| |
| This year, weaker economic fundamentals in India and China, the two largest global gold consuming nations, combined with a growing interest in stocks put downward pressure on the yellow metal. |
|
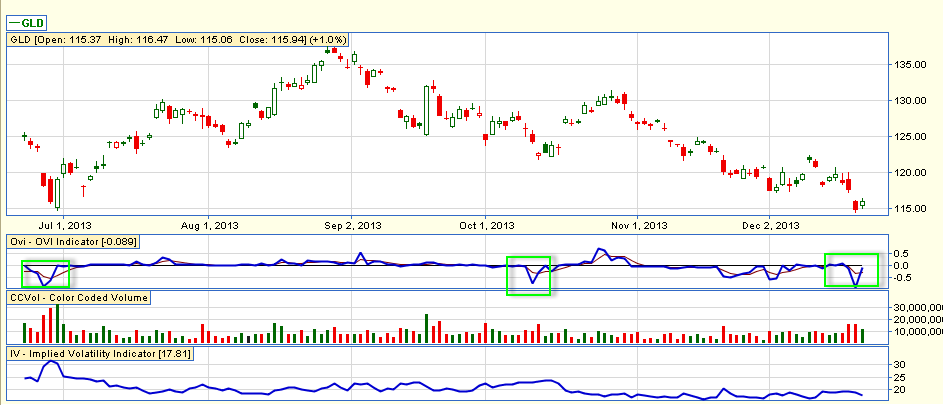
| Figure 3 � GLD daily OVI chart showing how options traders have been trading it. Green rectangles show periods of prior lows in the OVI and subsequent rallies. |
| Graphic provided by: www.FlagTrader.com. |
| |
| But there are indications that this drop could be nearing an end. First as we see from the next chart, options trading activity as measured by the OVI indicator, recently hit a mid-term low from which point GLD has rallied in past (see green rectangles). For a detailed description of the OVI indicator see "Tesla H&S Trade Update". |
| Second, according to the December 17, 2013 Commitment of Traders report, commercial traders reduced short positions by 681 contracts to a net short position of 56,130 gold contracts. Covering short positions by commercials is bullish for gold prices as long as the trend continues. From a purely technical perspective, gold will have to hold current support levels around $1200 for the metal and 115.00 for GLD. Any decisive breaches below these levels on above average volume will mean that precious metal demand and inflationary pressure are in for more downside. |
Matt Blackman is a full-time technical and financial writer and trader. He produces corporate and financial newsletters, and assists clients in getting published in the mainstream media. He is the host of TradeSystemGuru.com. Matt has earned the Chartered Market Technician (CMT) designation. Find out what stocks and futures Matt is watching on Twitter at www.twitter.com/RatioTrade
| Company: | TradeSystemGuru.com |
| Address: | Box 2589 |
| Garibaldi Highlands, BC Canada | |
| Phone # for sales: | 604-898-9069 |
| Fax: | 604-898-9069 |
| Website: | www.tradesystemguru.com |
| E-mail address: | indextradermb@gmail.com |
Traders' Resource Links | |
| TradeSystemGuru.com has not added any product or service information to TRADERS' RESOURCE. | |
Click here for more information about our publications!
Comments

Request Information From Our Sponsors
- StockCharts.com, Inc.
- Candle Patterns
- Candlestick Charting Explained
- Intermarket Technical Analysis
- John Murphy on Chart Analysis
- John Murphy's Chart Pattern Recognition
- John Murphy's Market Message
- MurphyExplainsMarketAnalysis-Intermarket Analysis
- MurphyExplainsMarketAnalysis-Visual Analysis
- StockCharts.com
- Technical Analysis of the Financial Markets
- The Visual Investor
- VectorVest, Inc.
- Executive Premier Workshop
- One-Day Options Course
- OptionsPro
- Retirement Income Workshop
- Sure-Fire Trading Systems (VectorVest, Inc.)
- Trading as a Business Workshop
- VectorVest 7 EOD
- VectorVest 7 RealTime/IntraDay
- VectorVest AutoTester
- VectorVest Educational Services
- VectorVest OnLine
- VectorVest Options Analyzer
- VectorVest ProGraphics v6.0
- VectorVest ProTrader 7
- VectorVest RealTime Derby Tool
- VectorVest Simulator
- VectorVest Variator
- VectorVest Watchdog