

HOT TOPICS LIST
- MACD
- Fibonacci
- RSI
- Gann
- ADXR
- Stochastics
- Volume
- Triangles
- Futures
- Cycles
- Volatility
- ZIGZAG
- MESA
- Retracement
- Aroon
INDICATORS LIST
LIST OF TOPICS
PRINT THIS ARTICLE
by Matt Blackman
There have been a host of calls from both bull and bear camps as to where stocks are headed. The S&P500 and SPY are now at a critical point, the resolution of which could signal a major move from here.
Position: N/A
Matt Blackman
Matt Blackman is a full-time technical and financial writer and trader. He produces corporate and financial newsletters, and assists clients in getting published in the mainstream media. He is the host of TradeSystemGuru.com. Matt has earned the Chartered Market Technician (CMT) designation. Find out what stocks and futures Matt is watching on Twitter at www.twitter.com/RatioTrade
PRINT THIS ARTICLE
MARKET TIMING
Whither The Santa Claus Rally?
12/20/13 11:40:05 AMby Matt Blackman
There have been a host of calls from both bull and bear camps as to where stocks are headed. The S&P500 and SPY are now at a critical point, the resolution of which could signal a major move from here.
Position: N/A
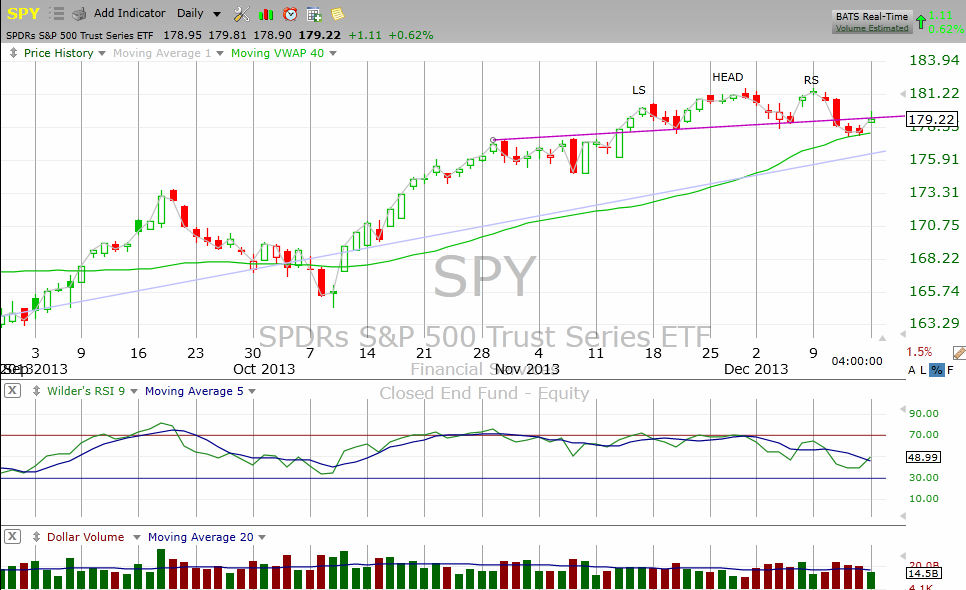
| As the market moved into the Christmas holidays, stocks were in a quandary. The 2013 rally was still technically alive but there were some troubling signs that a top may be at hand. The most recent was the bearish Head & Shoulders (H&S) pattern that had appeared on the S&P 500 and SPY which showed that buying was on the slide and selling on the rise (see Figure 1). |
|
| Figure 1 � Daily chart showing the December 16 move up to H&S neckline resistance. A decisive move above it would signal a bullish reversal and perhaps herald in the 2013 Santa Claus Rally. |
| Graphic provided by: TC2000.com. |
| |
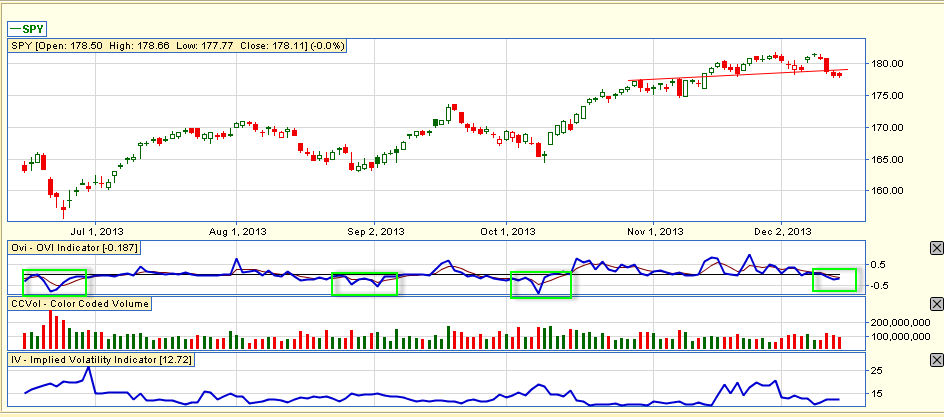
| But what markets did on Monday, December 16 showed that bullishness was still very much alive and well on Wall Street. As Figure 1 shows, the SPDRs S&P500 Trust ETF (SPY) gained 0.62% to close right at H&S neckline resistance after rallying above it intraday. Why is this significant? If there is a major rally above the neckline on above average volume, not only will it invalidate the bearish pattern, it will likely also herald in this year's Santa Claus rally. What other evidence do we have to provide a clearer picture? In Figure 2 you see the options activity on the SPY. Each time the OVI indicator, a master indicator of what options traders are doing, rebounds from an intermediate low (see green rectangles on the middle subgraph), the SPY has rallied. (For a more detailed description of the OVI see and "Tesla H&S Trade Update"). |
|
| Figure 2 � Daily chart of the SPY courtesy of Flagtrader.com showing the OVI indicator in the middle subgraph showing the move up from an intermediate low during the week of December 9-12 which indicates that options traders are getting more bullish on the stock. |
| Graphic provided by: http://www.Flagtrader.com. |
| |
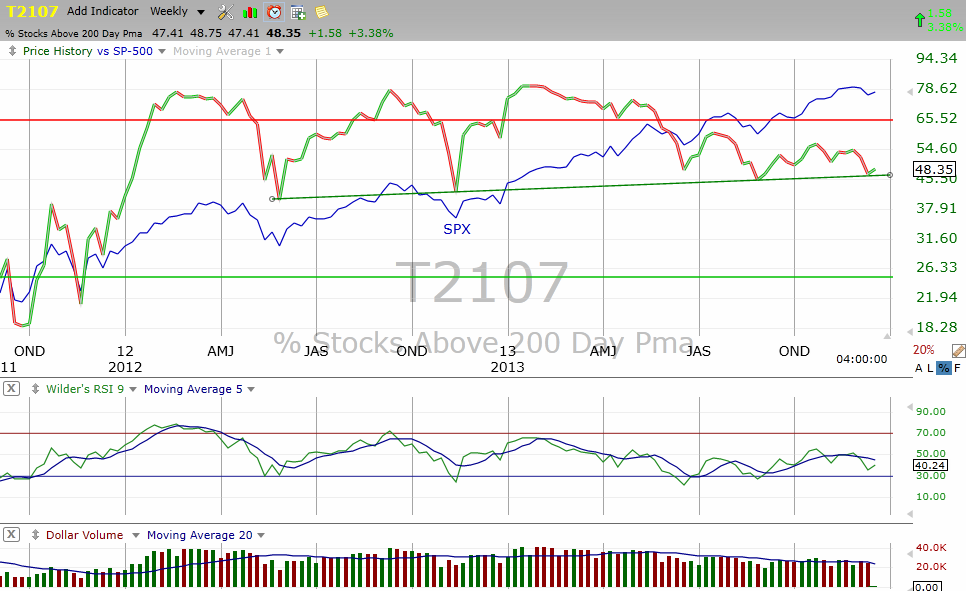
| And as we see from Figure 3, market breadth appears to be at mid-term support. It shows the number of stocks trading above their 200-day moving averages. Each time this line has hit uptrend support over the last 18 months, the S&P 500 has rallied. |
|
| Figure 3 � Since mid-2012 the number of stocks trading above their 200 day moving averages has found support in this area (see green trendline support) and it has been an area from which the market has rallied in the past. |
| Graphic provided by: TC2000.com. |
| |
| In summary, we are at a pivotal point on the S&P 500. If the bulls enter the market en masse during the week of December 16 - 20, the current bearish pattern could well be neutered ushering in a much-anticipated Santa Claus rally — a seasonal investor gift which historically arrives for the last five trading days of the year and first two trading days in the New Year. According to the 2013 Stock Trader's Almanac, this period has on average seen the SPX rise 1.5% in up years since 1950. However, if neckline resistance holds, it would lend credence to calls for a top in the market and could well signal the beginning of a major correction. |
| Another seasonal tidbit from the Almanac — investors tend to dump losers near year-end for tax purposes which can create bargains. NYSE stocks selling at their lows around December 15 generally outperform the market by February 15 of the following year. Have a very Merry Christmas and a Happy, Healthy and Profitable New Year! |
Matt Blackman is a full-time technical and financial writer and trader. He produces corporate and financial newsletters, and assists clients in getting published in the mainstream media. He is the host of TradeSystemGuru.com. Matt has earned the Chartered Market Technician (CMT) designation. Find out what stocks and futures Matt is watching on Twitter at www.twitter.com/RatioTrade
| Company: | TradeSystemGuru.com |
| Address: | Box 2589 |
| Garibaldi Highlands, BC Canada | |
| Phone # for sales: | 604-898-9069 |
| Fax: | 604-898-9069 |
| Website: | www.tradesystemguru.com |
| E-mail address: | indextradermb@gmail.com |
Traders' Resource Links | |
| TradeSystemGuru.com has not added any product or service information to TRADERS' RESOURCE. | |
Click here for more information about our publications!
PRINT THIS ARTICLE

Request Information From Our Sponsors
- VectorVest, Inc.
- Executive Premier Workshop
- One-Day Options Course
- OptionsPro
- Retirement Income Workshop
- Sure-Fire Trading Systems (VectorVest, Inc.)
- Trading as a Business Workshop
- VectorVest 7 EOD
- VectorVest 7 RealTime/IntraDay
- VectorVest AutoTester
- VectorVest Educational Services
- VectorVest OnLine
- VectorVest Options Analyzer
- VectorVest ProGraphics v6.0
- VectorVest ProTrader 7
- VectorVest RealTime Derby Tool
- VectorVest Simulator
- VectorVest Variator
- VectorVest Watchdog
- StockCharts.com, Inc.
- Candle Patterns
- Candlestick Charting Explained
- Intermarket Technical Analysis
- John Murphy on Chart Analysis
- John Murphy's Chart Pattern Recognition
- John Murphy's Market Message
- MurphyExplainsMarketAnalysis-Intermarket Analysis
- MurphyExplainsMarketAnalysis-Visual Analysis
- StockCharts.com
- Technical Analysis of the Financial Markets
- The Visual Investor