HOT TOPICS LIST
- MACD
- Fibonacci
- RSI
- Gann
- ADXR
- Stochastics
- Volume
- Triangles
- Futures
- Cycles
- Volatility
- ZIGZAG
- MESA
- Retracement
- Aroon
INDICATORS LIST
LIST OF TOPICS
PRINT THIS ARTICLE
by Koos van der Merwe
It looks as if the indices have come to the next signpost.
Position: Accumulate
Koos van der Merwe
Has been a technical analyst since 1969, and has worked as a futures and options trader with First Financial Futures in Johannesburg, South Africa.
PRINT THIS ARTICLE
FLAGS AND PENNANTS
That Signpost Down The Road
11/27/13 04:14:42 PMby Koos van der Merwe
It looks as if the indices have come to the next signpost.
Position: Accumulate
| My Elliott Wave counts of the Indexes told me to expect a correction during November. However, I have always said that an Elliott Wave count is simply a signpost, and can change at the next signpost a little way down the road. My charts are suggesting that the indexes may have reached that signpost. So, what is that signpost now telling us? |

|
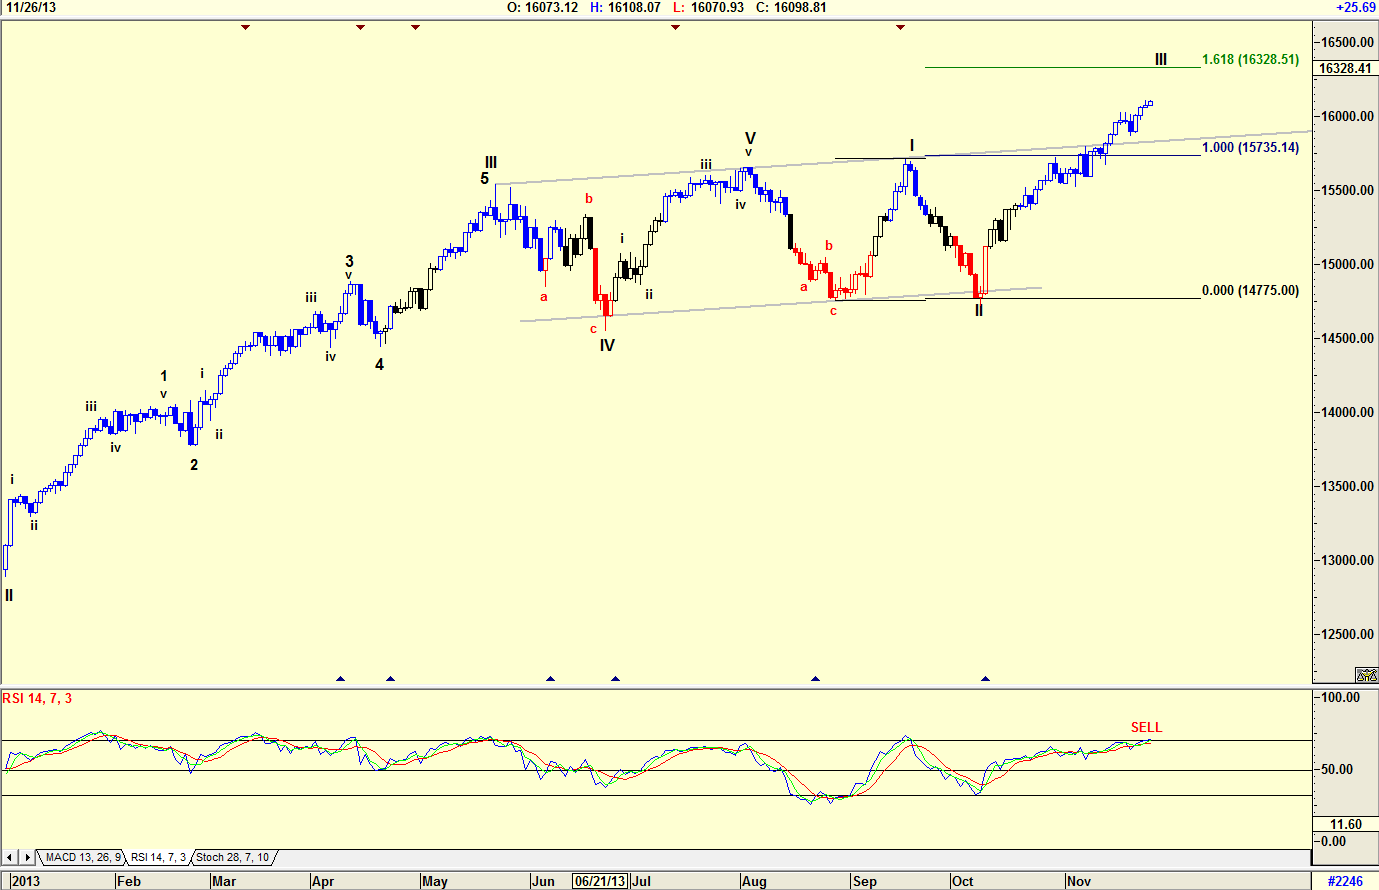
| Figure 1. Daily Elliott Wave count as I originally saw it. |
| Graphic provided by: AdvancedGET. |
| |
| The chart in Figure 1 is a chart of the Dow Jones with the Elliott Wave count from the last signpost. The wave count suggested that the Dow could be in a Wave III of a fresh bull market. The RSI indicator is at overbought levels, suggesting that a correction could occur in the near future. The target for Wave III is 16328.51, a 1.618 Fibonacci extension of Wave I. The Elliott Wave count does follow the first rule of Elliott Wave theory, namely the chart does look correct, however, a Flag pattern has developed, and the target projection of the Flag should be considered. |

|
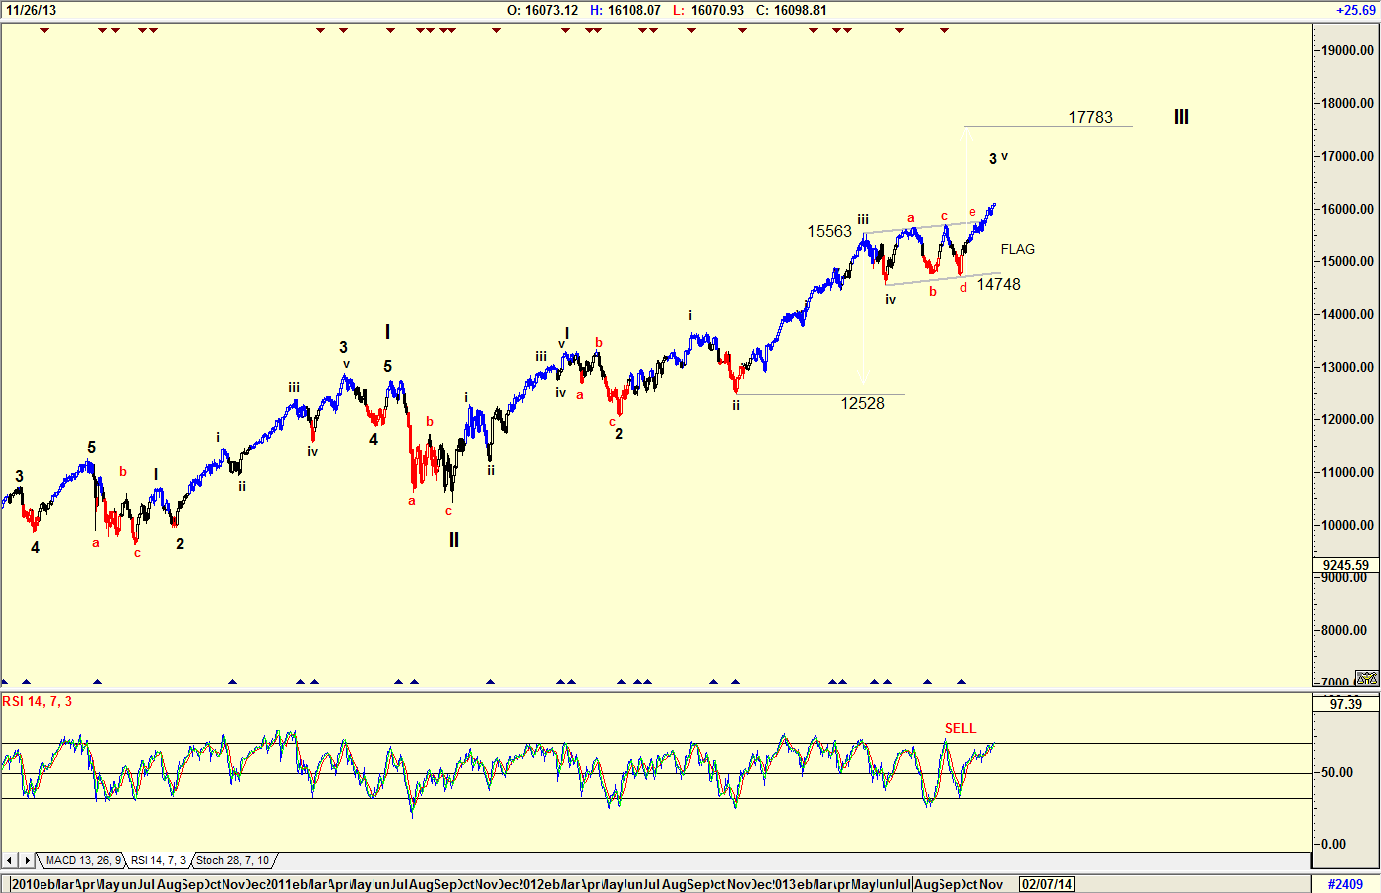
| Figure 2. Daily Elliott Count of the Dow as I now see it. |
| Graphic provided by: AdvancedGET. |
| |
| The Wave count in Figure 2 is very different from that of Figure 1. With this count I had to take the Flag pattern that has recently developed into consideration. The Wave count does follow the first rule of Elliott Wave theory, namely it does look correct, however the count is suggesting that the Dow is in a wave v of Wave 3 of WAVE III. The Flag is also suggesting a target of 17783. (15563 - 12528 + 14748 = 17783) With the RSI indicator not yet above the 70 horizontal line, and not yet in in a position to suggest a sell, this count does look very possible. The count also looks more correct than the wave count in Figure 1. |

|
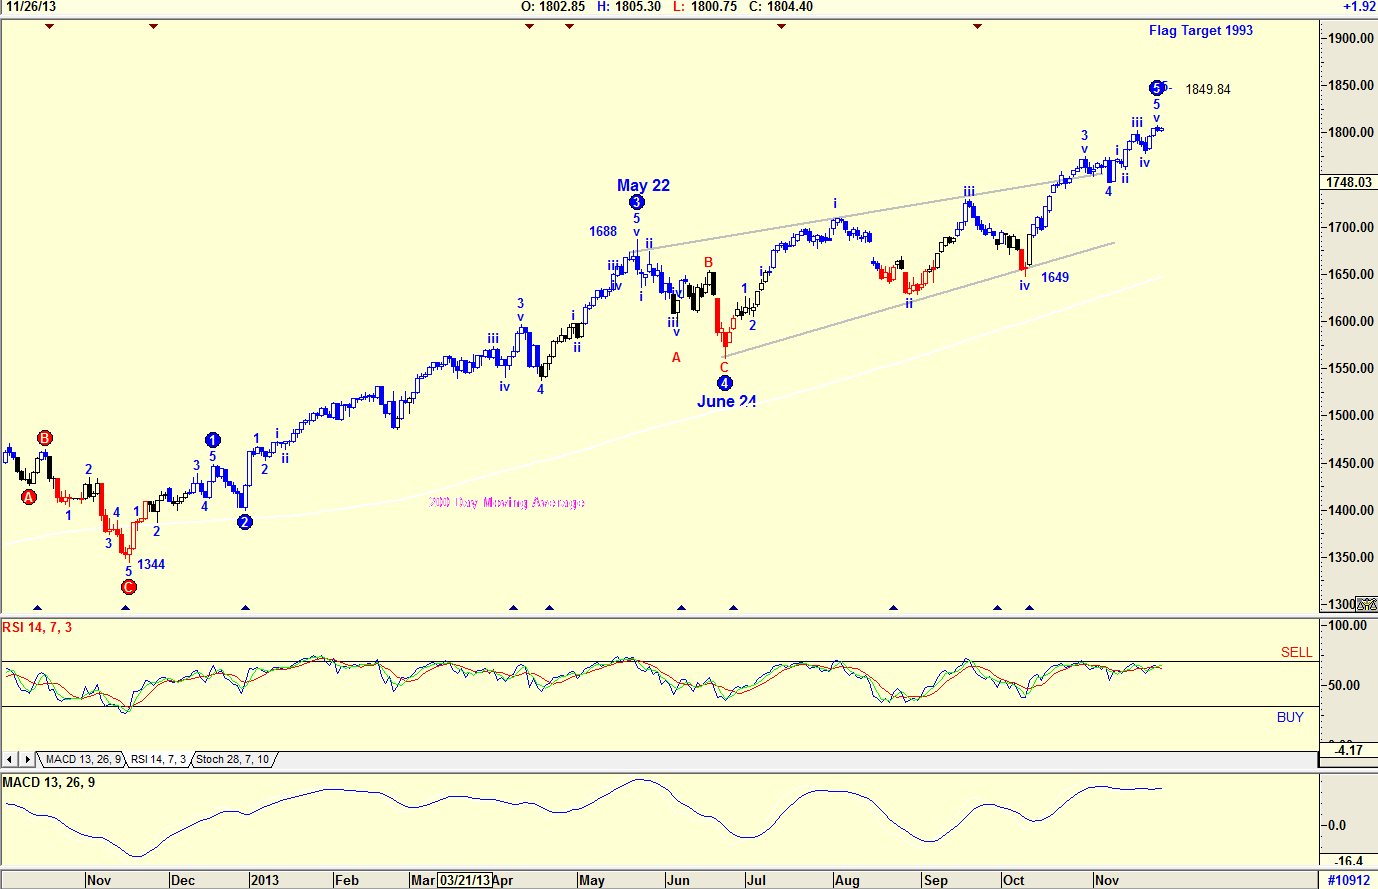
| Figure 3. Daily chart of the S&P500 Index with new wave count. |
| Graphic provided by: AdvancedGET. |
| |
| The chart in Figure 3 is a daily chart of the S&P500 index with an Elliott Wave count calculated by the Advanced GET program. This count is suggesting a WAVE 5 target of 1849.84. Once again the RSI indicator is not at overbought levels, suggesting that the rise to 1848.84 is indeed a possibility. Note that the MACD indicator appears to be struggling to determine direction. The target suggested by the rising Flag is 1993. |

|
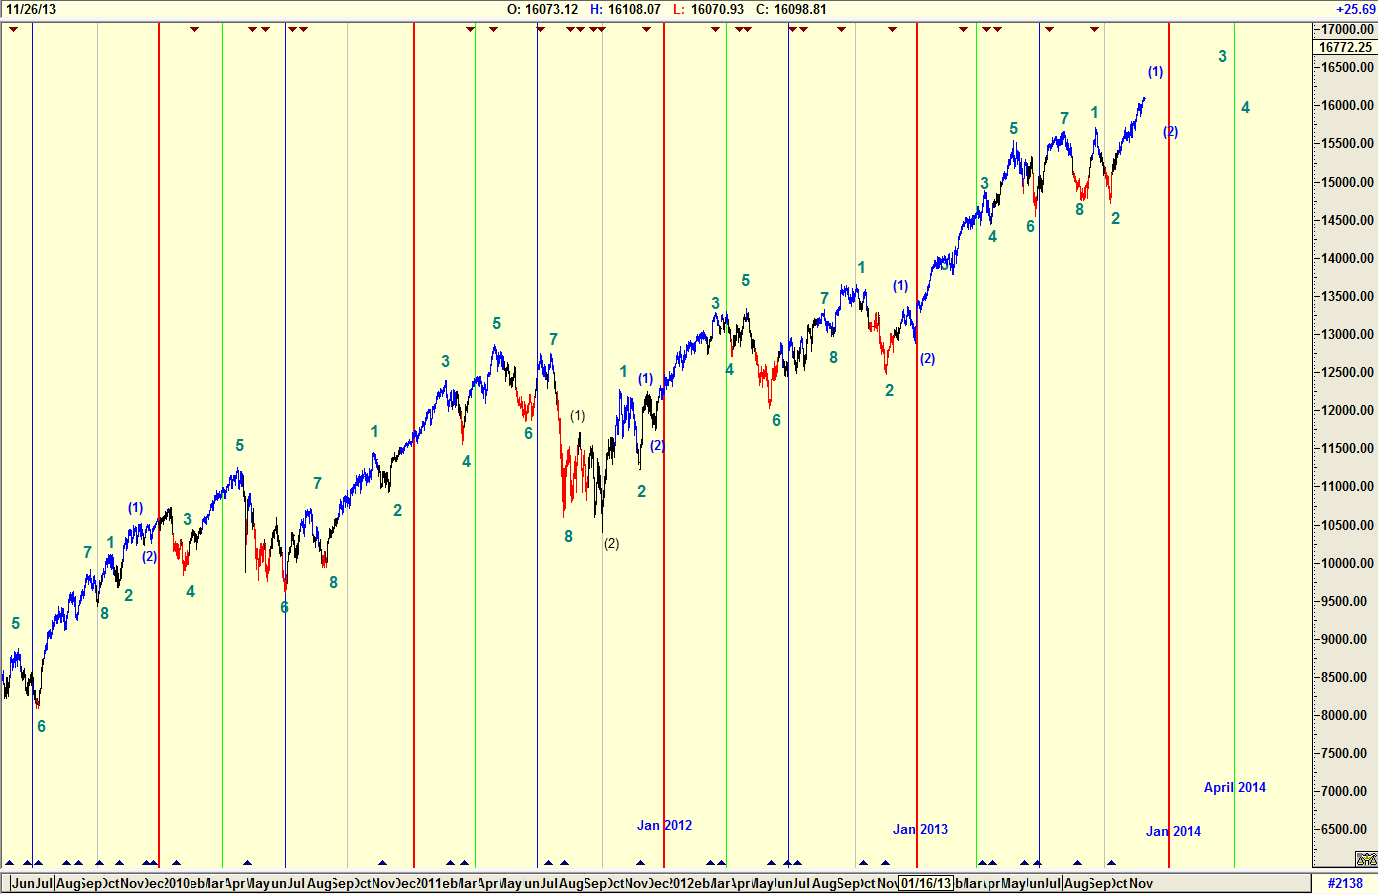
| Figure 4. Paget cyclical count of the Dow. |
| Graphic provided by: AdvancedGET. |
| |
| My final chart (Figure 4) is a Paget cyclical chart. This chart is suggesting a correction sometime in December, before a strong move up into April/May 2014. This is based on previous patterns over the same time period. The correction suggested will be a minor one as shown in previous years, a correction that will possibly happen in the week between Christmas and New Year, when everyone is on holiday. Yes...I have changed my short term viewpoint of the trend of the market. In my September article, I looked for a November correction. This has not occurred with the indexes forming a flag pattern — a bullish pattern. I would be a buyer of shares over the next three weeks, looking for bargains, with the plan of holding them into March/April 2014. |
Has been a technical analyst since 1969, and has worked as a futures and options trader with First Financial Futures in Johannesburg, South Africa.
| Address: | 3256 West 24th Ave |
| Vancouver, BC | |
| Phone # for sales: | 6042634214 |
| E-mail address: | petroosp@gmail.com |
Click here for more information about our publications!
Comments

Request Information From Our Sponsors
- StockCharts.com, Inc.
- Candle Patterns
- Candlestick Charting Explained
- Intermarket Technical Analysis
- John Murphy on Chart Analysis
- John Murphy's Chart Pattern Recognition
- John Murphy's Market Message
- MurphyExplainsMarketAnalysis-Intermarket Analysis
- MurphyExplainsMarketAnalysis-Visual Analysis
- StockCharts.com
- Technical Analysis of the Financial Markets
- The Visual Investor
- VectorVest, Inc.
- Executive Premier Workshop
- One-Day Options Course
- OptionsPro
- Retirement Income Workshop
- Sure-Fire Trading Systems (VectorVest, Inc.)
- Trading as a Business Workshop
- VectorVest 7 EOD
- VectorVest 7 RealTime/IntraDay
- VectorVest AutoTester
- VectorVest Educational Services
- VectorVest OnLine
- VectorVest Options Analyzer
- VectorVest ProGraphics v6.0
- VectorVest ProTrader 7
- VectorVest RealTime Derby Tool
- VectorVest Simulator
- VectorVest Variator
- VectorVest Watchdog
