

HOT TOPICS LIST
- MACD
- Fibonacci
- RSI
- Gann
- ADXR
- Stochastics
- Volume
- Triangles
- Futures
- Cycles
- Volatility
- ZIGZAG
- MESA
- Retracement
- Aroon
INDICATORS LIST
LIST OF TOPICS
PRINT THIS ARTICLE
by Koos van der Merwe
The Syrian chemical weapons problem is over; Larry Summers has withdrawn from succeeding Ben Bernanke; the Federal Reserve is maintaining its buying of Bonds. What now?
Position: Sell
Koos van der Merwe
Has been a technical analyst since 1969, and has worked as a futures and options trader with First Financial Futures in Johannesburg, South Africa.
PRINT THIS ARTICLE
ELLIOTT WAVE
When In Doubt Stay Out
09/24/13 03:44:48 PMby Koos van der Merwe
The Syrian chemical weapons problem is over; Larry Summers has withdrawn from succeeding Ben Bernanke; the Federal Reserve is maintaining its buying of Bonds. What now?
Position: Sell
| The uncertainty in the political arena of the United States is continuing, with Congress voting against funding Obamacare. The next uncertainty in the arena is the shutting down of the White House. President Obama's budget director, Sylvia Matthews Burwell in a memo to agencies, said that they should set their plans in case Congress fails to pass a funding measure by the end of September. The government would shut down on October 1st without action by Congress. How does the market feel about all this uncertainty? |
|
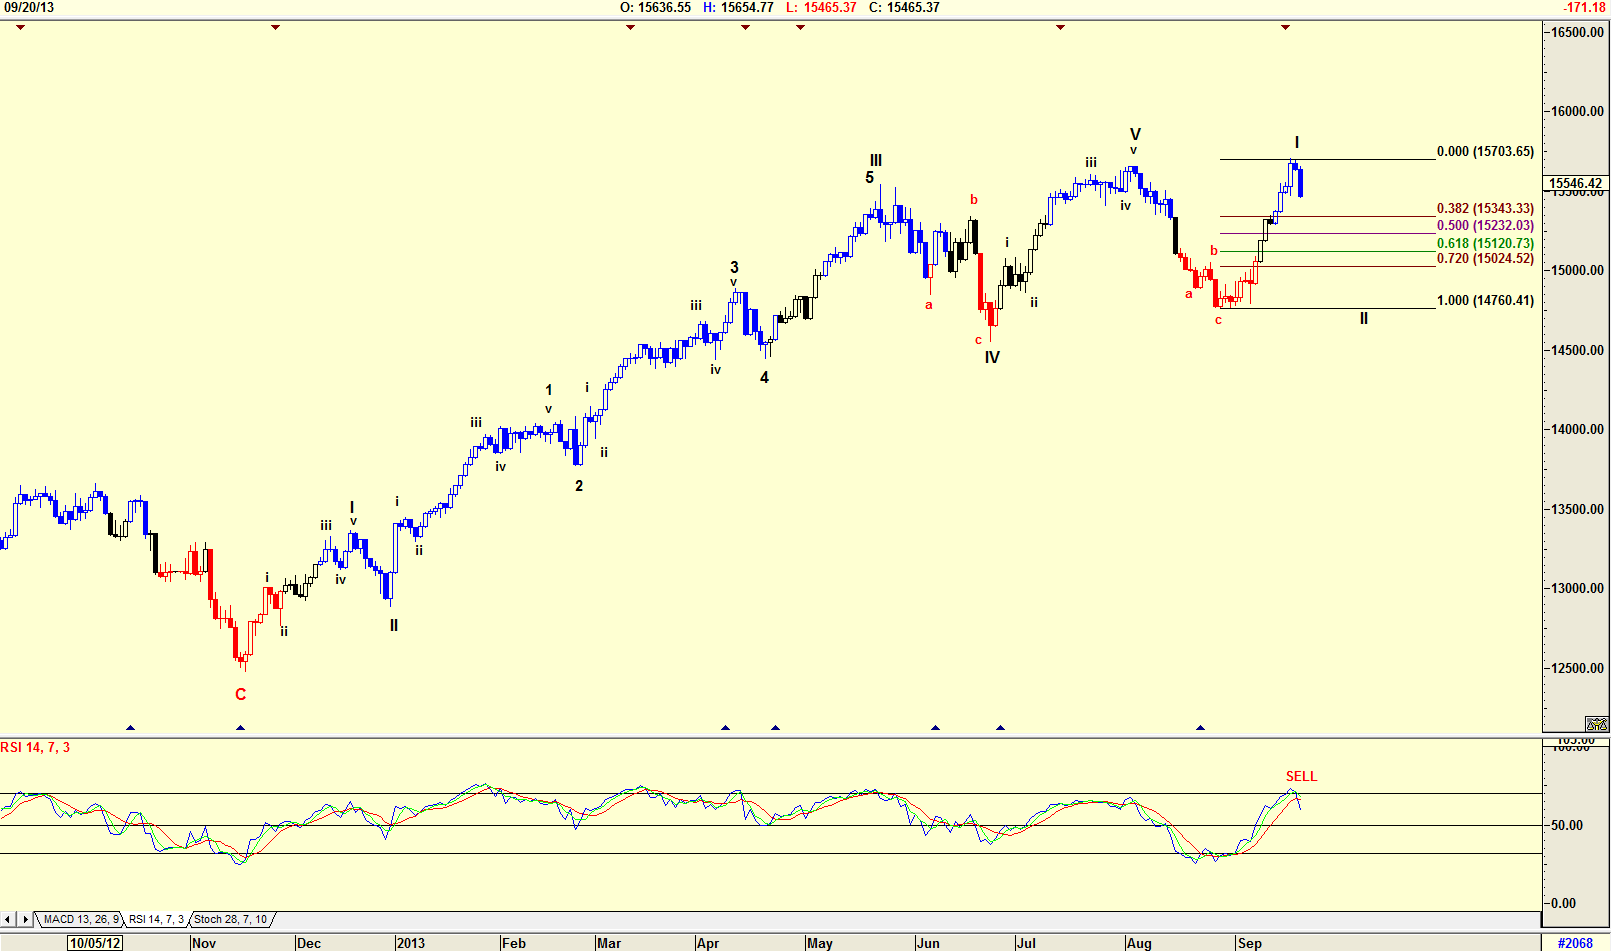
| Figure 1. Daily Elliott Wave count of the Dow. |
| Graphic provided by: AdvancedGET. |
| |
| The chart in Figure 1 is an Elliott Wave count of the Dow Jones suggesting that the Dow is now moving into a WAVE II correction in a major BULL market. The wave count follows the first rule of Elliott Wave theory, namely "the count must look correct." A Wave 2 can be as much as a 72%, if not more, correction of a Wave 1 rise, which means that the Dow could now correct to any one of the Fibonacci retracement levels shown on the chart, including a 100% retracement to 14760.41. The RSI indicator has given a SELL signal, so a correction is on the cards. |
|
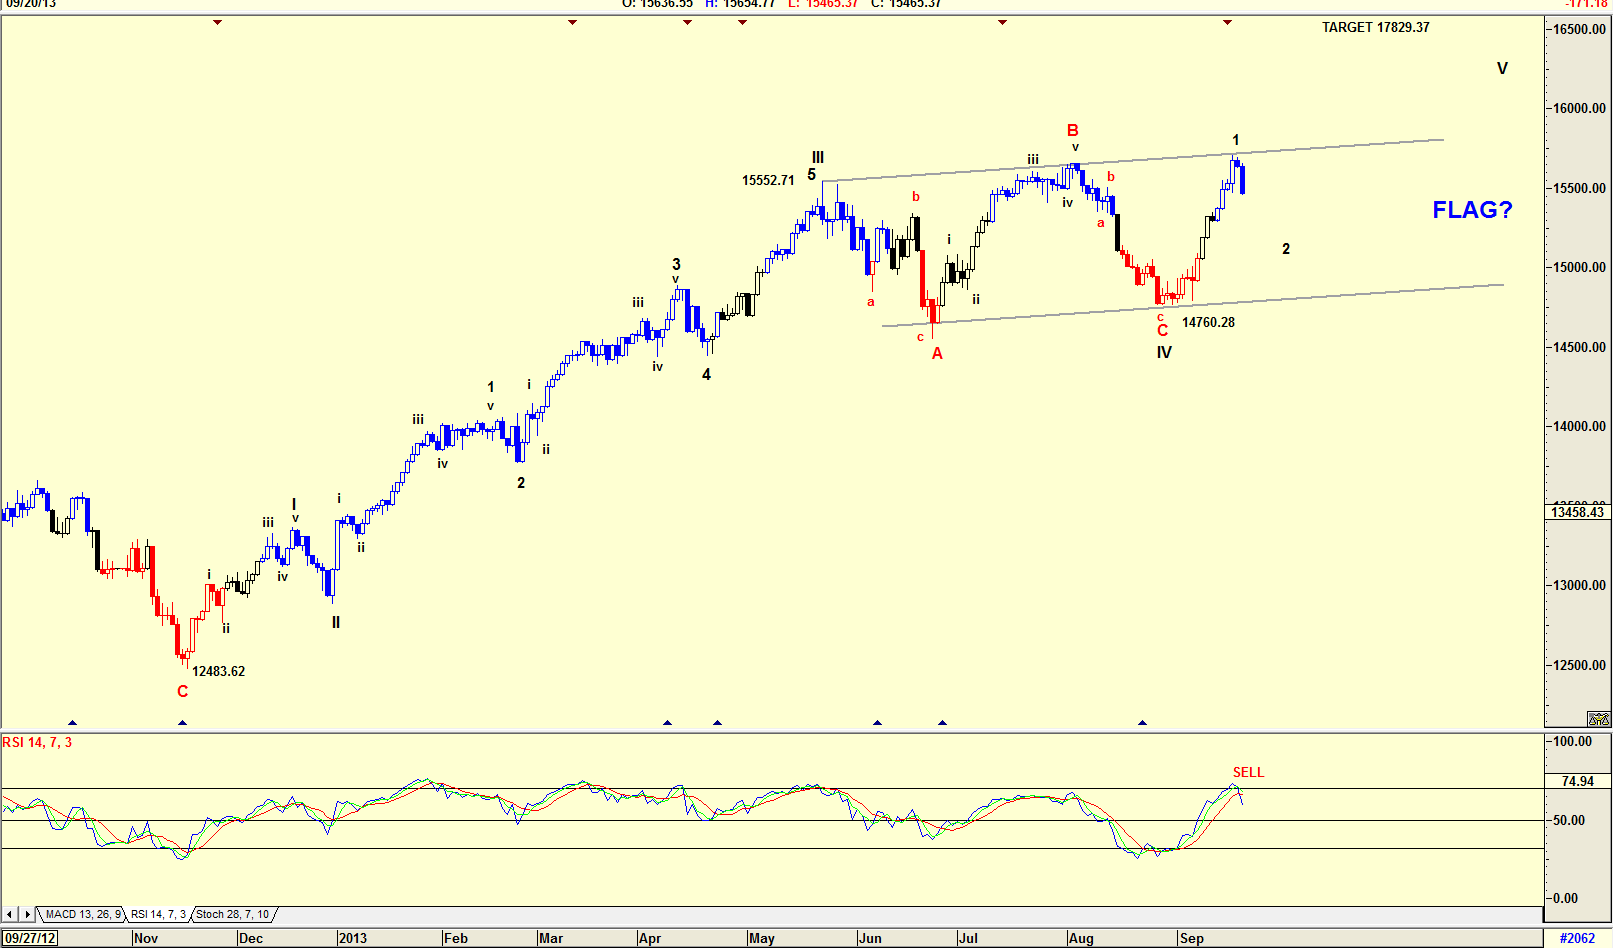
| Figure 2. Alternate Elliott Wave count of the Dow. |
| Graphic provided by: AdvancedGET. |
| |
| The chart in Figure 2 is an alternate Elliott Wave count. One of the Elliott Wave rules is that if the wave 2 correction is simple, then wave 4 must be complicated, and vice versa. The chart suggests that WAVE II is indeed extremely simple. With all the uncertainty out there, WAVE IV could then have been extremely complicated, and the chart shows exactly how complicated. The chart formation for WAVE IV looks as though it is a FLAG pattern. If this is the case, then the target for the WAVE V is 17829.37, (15552.71-12483.62=3069.09+14760.28=17829.37). This does suggest that although over the short term the political sparring between President Obama and Speaker of the House of Representatives, John Boehner, will cause the Dow to fall, over the long term the Dow will rise strongly to new heights. Whichever Elliott Wave count is the correct count, both suggest that a short term correction is on the cards. The reason for the correction could be the political uncertainty in the United States as a Republican-controlled House asserts its authority by blocking any plan President Obama has up his sleeve. Warren Buffett has always said, "WHEN IN DOUBT, STAY OUT." At the moment, there is plenty of doubt. |
Has been a technical analyst since 1969, and has worked as a futures and options trader with First Financial Futures in Johannesburg, South Africa.
| Address: | 3256 West 24th Ave |
| Vancouver, BC | |
| Phone # for sales: | 6042634214 |
| E-mail address: | petroosp@gmail.com |
Click here for more information about our publications!
Comments

Request Information From Our Sponsors
- StockCharts.com, Inc.
- Candle Patterns
- Candlestick Charting Explained
- Intermarket Technical Analysis
- John Murphy on Chart Analysis
- John Murphy's Chart Pattern Recognition
- John Murphy's Market Message
- MurphyExplainsMarketAnalysis-Intermarket Analysis
- MurphyExplainsMarketAnalysis-Visual Analysis
- StockCharts.com
- Technical Analysis of the Financial Markets
- The Visual Investor
- VectorVest, Inc.
- Executive Premier Workshop
- One-Day Options Course
- OptionsPro
- Retirement Income Workshop
- Sure-Fire Trading Systems (VectorVest, Inc.)
- Trading as a Business Workshop
- VectorVest 7 EOD
- VectorVest 7 RealTime/IntraDay
- VectorVest AutoTester
- VectorVest Educational Services
- VectorVest OnLine
- VectorVest Options Analyzer
- VectorVest ProGraphics v6.0
- VectorVest ProTrader 7
- VectorVest RealTime Derby Tool
- VectorVest Simulator
- VectorVest Variator
- VectorVest Watchdog