HOT TOPICS LIST
- MACD
- Fibonacci
- RSI
- Gann
- ADXR
- Stochastics
- Volume
- Triangles
- Futures
- Cycles
- Volatility
- ZIGZAG
- MESA
- Retracement
- Aroon
INDICATORS LIST
LIST OF TOPICS
PRINT THIS ARTICLE
by Andrew Hetherington
Flextronics (FLEX) has been dropping for some time and this trend will not change. In fact, the future looks quite gloomy for this chart.
Position: N/A
Andrew Hetherington
Classic Dow Theorist who trades as a pure technician, using pattern recognition.
PRINT THIS ARTICLE
CHART ANALYSIS
Flextronics International's Rising Wedge of Worry
09/27/02 02:03:33 PMby Andrew Hetherington
Flextronics (FLEX) has been dropping for some time and this trend will not change. In fact, the future looks quite gloomy for this chart.
Position: N/A
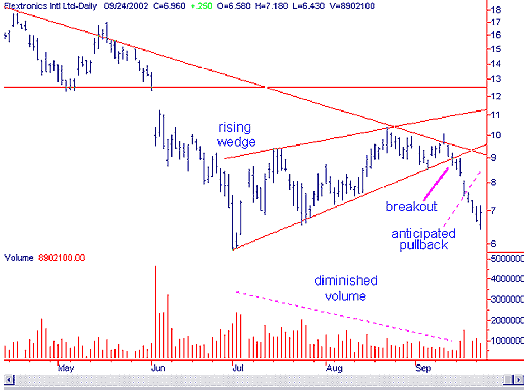
 Figure 1: FLEX daily chart. Flextronic's daily chart shows a 3-month rising wedge pattern. I usually refer to this as the rising wall of worry, since it is rising on continually lighter volume until the bottom falls out. This style of pattern can be misdiagnosed as previously discussed, so you can avoid mistakes by focusing on the stock's volume. |
| After the breakout in the $9.00 area it dropped to $6.43. I can now anticipate the inevitable pullback to the sell short position of $8.50 - $9.00. Since I have a clear indication of direction with the breakout and subsequent increased volume on the downside, I can prepare to go short along with the general market in the 8200-8300 area. This chart is having a pullback at the same time as the Dow and that is no coincidence. Most equities follow the general market. There are exceptions to this rule but usually this is the safest style of trading. |

|
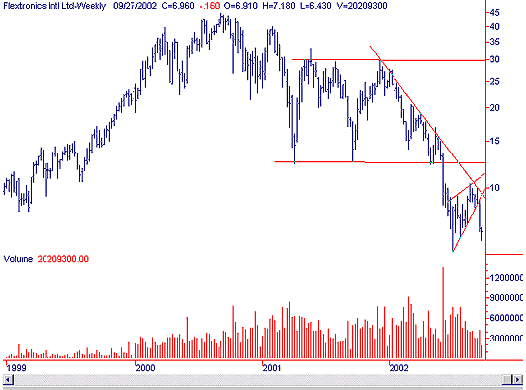
| Figure 2: FLEX weekly chart. |
| Graphic provided by: SuperCharts. |
| |
| How far and when? This is a small pattern and therefore has less power behind the anticipated move. However, it is a continuation pattern of the previous trend, which is down. Above is a large awkward looking rectangle on the weekly chart. It is an imperfect rectangle and the volume is shabby, but it is present. Since the large rectangle pattern is not perfect I wouldn't trade this equity until it formed another pattern such as this wedge. It won't take long to drop, perhaps as little as a few weeks and I anticipate it to drop to an all time low below $5.48. Usually it meanders down slowly after the pullback so it will likely take a little more time to unravel. This is unlike a breaking of the third fan line when the equities fall apart at the seams. If I were holding this equity in a long position I would unwind my position on this pullback and sell into the strength. |
Classic Dow Theorist who trades as a pure technician, using pattern recognition.
| Toronto, Canada |
Click here for more information about our publications!
Comments
Date: 10/02/02Rank: 5Comment: How can I contact Andrew, and I would like him to comment on the DOW 30.
Thanks,
Wally Lowe
Halifax

Request Information From Our Sponsors
- StockCharts.com, Inc.
- Candle Patterns
- Candlestick Charting Explained
- Intermarket Technical Analysis
- John Murphy on Chart Analysis
- John Murphy's Chart Pattern Recognition
- John Murphy's Market Message
- MurphyExplainsMarketAnalysis-Intermarket Analysis
- MurphyExplainsMarketAnalysis-Visual Analysis
- StockCharts.com
- Technical Analysis of the Financial Markets
- The Visual Investor
- VectorVest, Inc.
- Executive Premier Workshop
- One-Day Options Course
- OptionsPro
- Retirement Income Workshop
- Sure-Fire Trading Systems (VectorVest, Inc.)
- Trading as a Business Workshop
- VectorVest 7 EOD
- VectorVest 7 RealTime/IntraDay
- VectorVest AutoTester
- VectorVest Educational Services
- VectorVest OnLine
- VectorVest Options Analyzer
- VectorVest ProGraphics v6.0
- VectorVest ProTrader 7
- VectorVest RealTime Derby Tool
- VectorVest Simulator
- VectorVest Variator
- VectorVest Watchdog
