

HOT TOPICS LIST
- MACD
- Fibonacci
- RSI
- Gann
- ADXR
- Stochastics
- Volume
- Triangles
- Futures
- Cycles
- Volatility
- ZIGZAG
- MESA
- Retracement
- Aroon
INDICATORS LIST
LIST OF TOPICS
PRINT THIS ARTICLE
by Andrew Hetherington
A head and shoulders pattern with diminishing volume signals a shorting opportunity.
Position: N/A
Andrew Hetherington
Classic Dow Theorist who trades as a pure technician, using pattern recognition.
PRINT THIS ARTICLE
CHART ANALYSIS
A Painful Head and Shoulder is Lurking for Merck & Company
09/26/02 10:26:32 AMby Andrew Hetherington
A head and shoulders pattern with diminishing volume signals a shorting opportunity.
Position: N/A
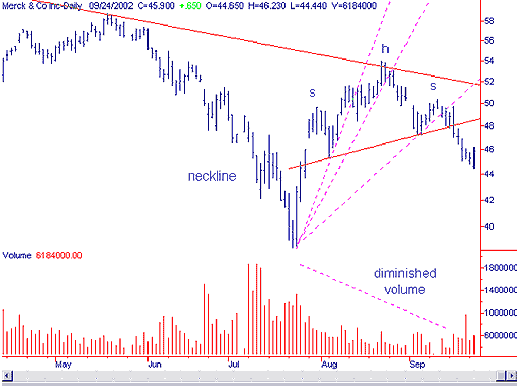 Figure 1: Daily chart of Merck & Co. (MRK). The daily chart for Merck & Company (MRK) illustrates the pain to come. We have a 2-month head and shoulders pattern with perfectly diminished volume on the creation of the pattern. Playing a short off the top of the intermediate trendline was as sure a bet as there is in the equities markets. Taking a short position in the $50.00 area after the third fan line confirmation, was a given. On September 17 it pulled back to the fan line in the $49.65 area before making a one-day reversal with good volume. Although it was not extraordinary volume, it was an increase in recent activity that day with 6.4 million shares. The upsloping neckline was also broken on this short-term phenomenon and there was every reason to believe a downward move was likely. At this point the customary pullback to the line in the $47.50 areas is likely. This will be the optimum time to short it once again. Anticipating a downward move to the previous bottom of $38.50 seems inevitable. If things get really bad then it will even go lower, however, if it stalls at this support, buying back your short is the safest thing to do. Shorting is about discipline. Making small amounts often as opposed to the grand slam. |
|
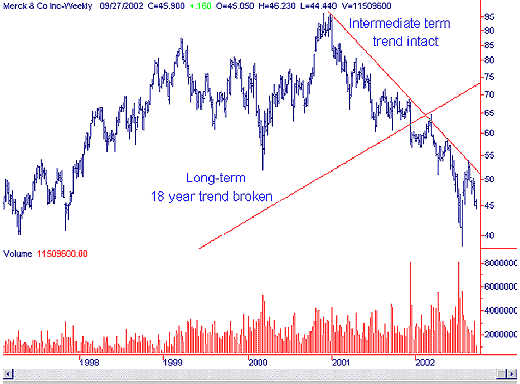
| Figure 2: Weekly chart of Merck & Co. |
| Graphic provided by: SuperCharts. |
| |
| In Figure 2 you can see the downward intermediate trend is still intact on the weekly chart. This trend will continue. The volume on the small head and shoulders is easier to view from this chart. It diminishes throughout the construction of the pattern. In addition, the 18-year long-term trend has been broken in the $62.00 areas. |
Classic Dow Theorist who trades as a pure technician, using pattern recognition.
| Toronto, Canada |
Click here for more information about our publications!
Comments
Date:�10/01/02Rank:�4Comment:�
Date:�10/01/02Rank:�3Comment:�
Date:�10/05/02Rank:�5Comment:�Excellent Article. What free charting service/program would you recommend with decent amount of indicators? Thanks.
Cheers,Padhu

Request Information From Our Sponsors
- VectorVest, Inc.
- Executive Premier Workshop
- One-Day Options Course
- OptionsPro
- Retirement Income Workshop
- Sure-Fire Trading Systems (VectorVest, Inc.)
- Trading as a Business Workshop
- VectorVest 7 EOD
- VectorVest 7 RealTime/IntraDay
- VectorVest AutoTester
- VectorVest Educational Services
- VectorVest OnLine
- VectorVest Options Analyzer
- VectorVest ProGraphics v6.0
- VectorVest ProTrader 7
- VectorVest RealTime Derby Tool
- VectorVest Simulator
- VectorVest Variator
- VectorVest Watchdog
- StockCharts.com, Inc.
- Candle Patterns
- Candlestick Charting Explained
- Intermarket Technical Analysis
- John Murphy on Chart Analysis
- John Murphy's Chart Pattern Recognition
- John Murphy's Market Message
- MurphyExplainsMarketAnalysis-Intermarket Analysis
- MurphyExplainsMarketAnalysis-Visual Analysis
- StockCharts.com
- Technical Analysis of the Financial Markets
- The Visual Investor