HOT TOPICS LIST
- MACD
- Fibonacci
- RSI
- Gann
- ADXR
- Stochastics
- Volume
- Triangles
- Futures
- Cycles
- Volatility
- ZIGZAG
- MESA
- Retracement
- Aroon
INDICATORS LIST
LIST OF TOPICS
PRINT THIS ARTICLE
by Koos van der Merwe
"Facebook has exploded upwards. The question everyone is asking is, 'How much higher can it go?'" That is the question I asked on September 26, 2013.
Position: Buy
Koos van der Merwe
Has been a technical analyst since 1969, and has worked as a futures and options trader with First Financial Futures in Johannesburg, South Africa.
PRINT THIS ARTICLE
ELLIOTT WAVE
That Stock Of Facebook, Again!
11/04/13 04:37:34 PMby Koos van der Merwe
"Facebook has exploded upwards. The question everyone is asking is, 'How much higher can it go?'" That is the question I asked on September 26, 2013.
Position: Buy
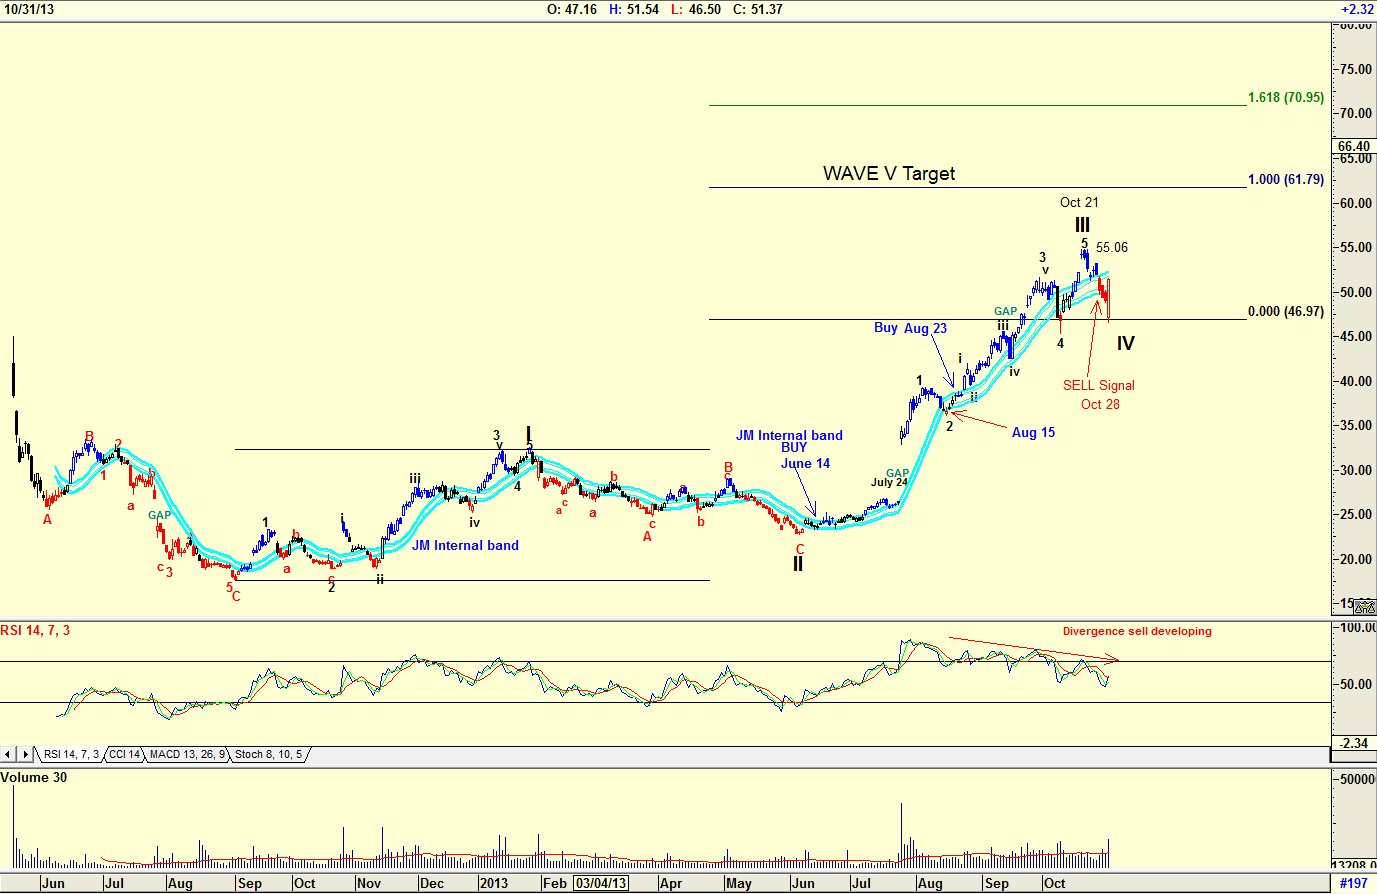
| On September 26, 2013 I wrote an article researching Facebook (FB) ("How High Can Facebook Go?") and concluded with the following statement. "I would only be a buyer of FB on a correction. The WAVE III target of $62.34 looks tempting. However, the RSI divergence sell that is developing bears watching." Was I correct in my conclusion? Let us have a look at the charts especially now in the light of Facebook's earnings, which were excellent. However, David Ebersman, the CFO of Facebook put a wet blanket on FB when he said, "... decrease in daily users specifically among younger teens." In after hours trading, FB shares that had risen to a high of $57 on excellent financial results, dropped to a low of $47. Was that the correction I was looking for? |

|
| Figure 1. Daily chart of Facebook (FB). |
| Graphic provided by: AdvancedGET. |
| |
| The daily chart in Figure 1 shows how the price rose to a WAVE III high of $55.06 by October 21, 2013 and then fell in a WAVE IV correction to a low of $46.97. This now gives us a target for WAVE V. A Wave 5 should always be equal to a wave 1. That is the basic Elliott Wave rule. Yes, it can be shorter, and yes, it can be greater, but as a rule of thumb guide, in following the first rule of Elliott Wave theory, viz. The Chart must always "look correct" we now have a target that FB shares could rise to in a WAVE V top. That target is $61.79. Do note on the chart that FB shares, in that magnificent correction on the words, "decrease... among younger teens," did not fall below the 4th wave of lesser degree, adhering to a basic Elliott Wave rule. The negative on the chart is still the divergence sell signal given by the RSI indicator. Also note that the share price gave a JM Internal Band sell on October 28, 2013 and has not yet broken above the upper JM Internal band suggesting a buy. The JM Internal Band is a 15-period simple moving average offset by 2% positive and 2% negative. A move of the share price above the upper band suggests a buy and a move below the lower band, a sell. |

|
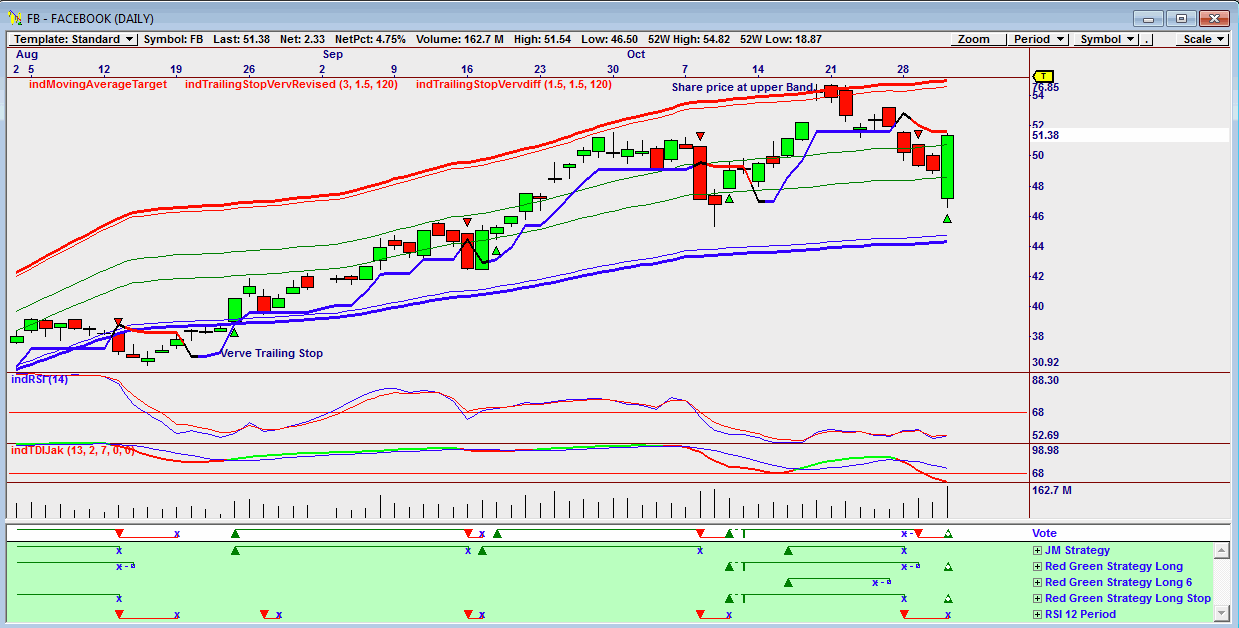
| Figure 2. Omnitrader Chart suggesting a BUY on the Vote line. |
| Graphic provided by: Omnitrader. |
| |
| The chart in Figure 2 is an Omnitrader chart with the Vote line suggesting a buy signal based on the Red Green strategy Long and the Red Green Strategy Long Stop shown in green below. Note how the share price topped out when it tested the upper external band line. The price has however not broken above the Verve Trailing stop — not that this is important but it is worth noting. The indicator TDIJak is still showing negativity but the RSI indicator has given a buy signal. Yes, I would be a buyer of FB at a price below $50. |
Has been a technical analyst since 1969, and has worked as a futures and options trader with First Financial Futures in Johannesburg, South Africa.
| Address: | 3256 West 24th Ave |
| Vancouver, BC | |
| Phone # for sales: | 6042634214 |
| E-mail address: | petroosp@gmail.com |
Click here for more information about our publications!
Comments

Request Information From Our Sponsors
- StockCharts.com, Inc.
- Candle Patterns
- Candlestick Charting Explained
- Intermarket Technical Analysis
- John Murphy on Chart Analysis
- John Murphy's Chart Pattern Recognition
- John Murphy's Market Message
- MurphyExplainsMarketAnalysis-Intermarket Analysis
- MurphyExplainsMarketAnalysis-Visual Analysis
- StockCharts.com
- Technical Analysis of the Financial Markets
- The Visual Investor
- VectorVest, Inc.
- Executive Premier Workshop
- One-Day Options Course
- OptionsPro
- Retirement Income Workshop
- Sure-Fire Trading Systems (VectorVest, Inc.)
- Trading as a Business Workshop
- VectorVest 7 EOD
- VectorVest 7 RealTime/IntraDay
- VectorVest AutoTester
- VectorVest Educational Services
- VectorVest OnLine
- VectorVest Options Analyzer
- VectorVest ProGraphics v6.0
- VectorVest ProTrader 7
- VectorVest RealTime Derby Tool
- VectorVest Simulator
- VectorVest Variator
- VectorVest Watchdog
