HOT TOPICS LIST
- MACD
- Fibonacci
- RSI
- Gann
- ADXR
- Stochastics
- Volume
- Triangles
- Futures
- Cycles
- Volatility
- ZIGZAG
- MESA
- Retracement
- Aroon
INDICATORS LIST
LIST OF TOPICS
PRINT THIS ARTICLE
by Koos van der Merwe
Facebook has exploded upwards. The question everyone is asking is, "How much higher can it go?"
Position: Accumulate
Koos van der Merwe
Has been a technical analyst since 1969, and has worked as a futures and options trader with First Financial Futures in Johannesburg, South Africa.
PRINT THIS ARTICLE
ELLIOTT WAVE
How High Can Facebook Go?
09/26/13 05:12:54 PMby Koos van der Merwe
Facebook has exploded upwards. The question everyone is asking is, "How much higher can it go?"
Position: Accumulate
| We all know that Facebook's listing on the exchange was a disaster. We also know that Mark Zuckerberg is a very clever man, and a quick learner. So, placing a bet with Zuckerberg for the long-term can only be an advantage. Having said that, would you buy Facebook (FB) now? |

|
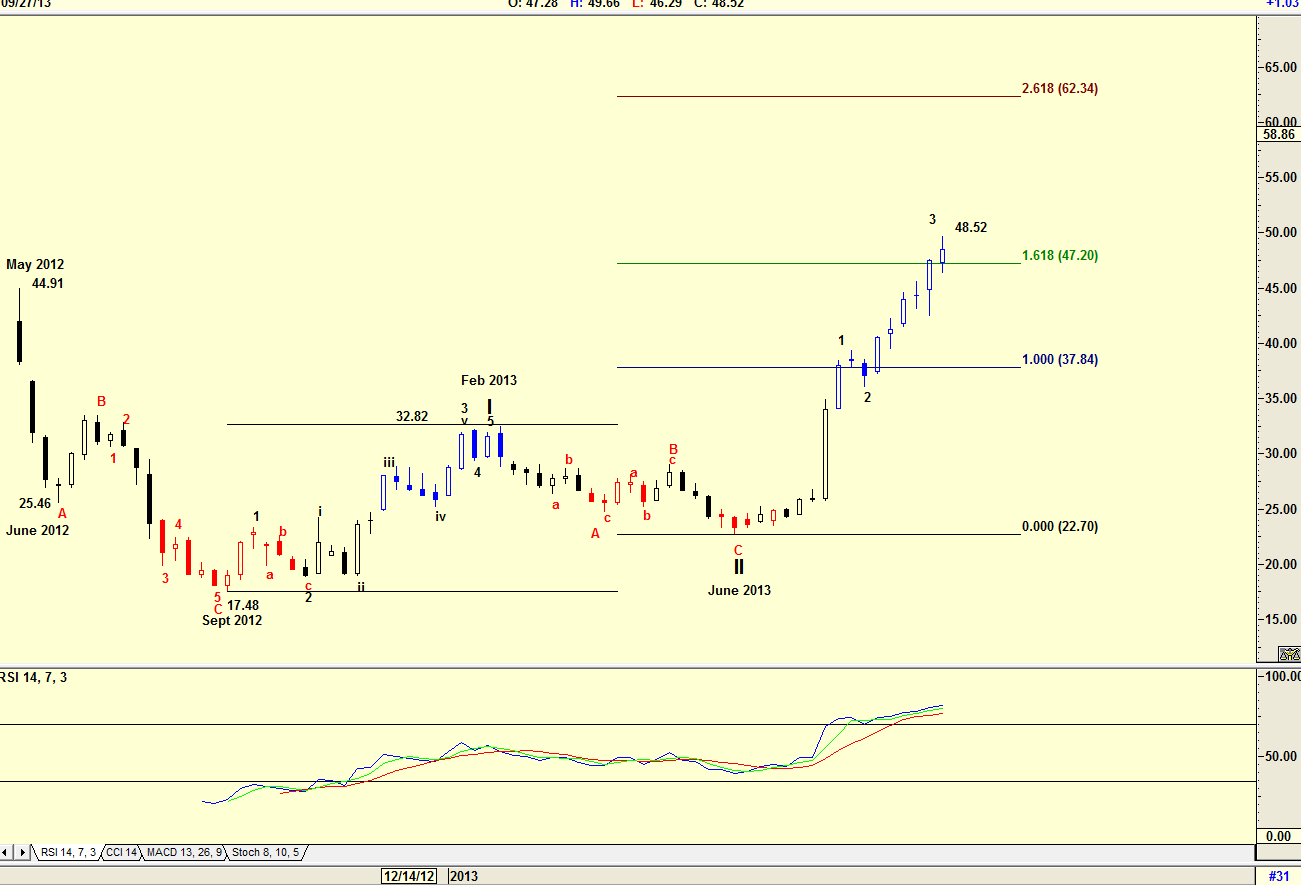
| Figure 1. Weekly chart with Elliott Wave count and Fibonacci extension target. |
| Graphic provided by: AdvancedGET. |
| |
| The weekly chart in Figure 1 shows how the price touched a high of $44.91 after listing on the stock market in May 2012, then promptly dropped to $25.46 by June 2012. The price continued falling reaching a low of $17.48 by September 2012 before starting to recover, reaching a high of $32.82 by February 2013 in a Wave 1 rise. Wave II saw the share fall to $22.70 by June 2013, and started rising strongly to its current price of $48.52. Elliott Wave rules state that a wave 3 must equal or be greater than a wave 1. The chart shows that WAVE III is so far greater than the 1.618% Fibonacci extension, suggesting that the price could rise to the 2.618% Fibonacci value with a price of $62.34. The RSI indicator is at overbought levels, but has not given a sell signal, so the rise to $62.34 looks possible. |

|
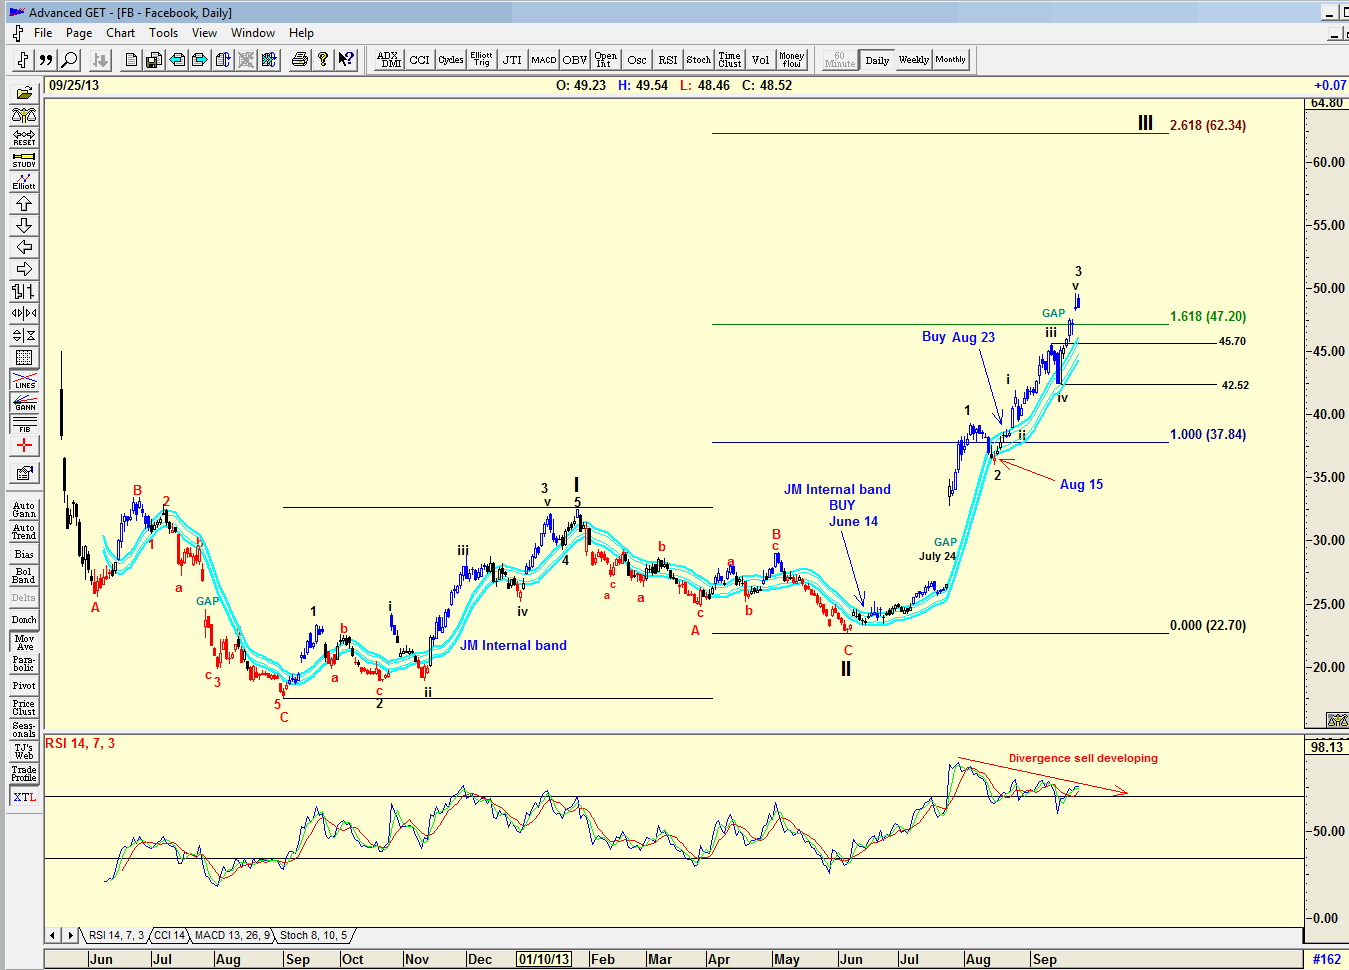
| Figure 2. Daily chart with wave count and JM Internal Band indicator. |
| Graphic provided by: AdvancedGET. |
| |
| The daily chart in Figure 2 displays an Elliott Wave count suggesting that the share price is tracing a Wave 3 of WAVE III. The RSI indicator is trending down, and has given a number of sell signals that the price has ignored. With the RSI indicator dropping, and the share price rising, we could see the development of a divergence sell signal. The share price should correct in a wave 4 of WAVE III in the near future, taking the price down to somewhere between $45.70-42.52, but with the present optimism in the share price, this could be a gradual correction. The wave 2 correction was a simple correction, which means that the wave 4 correction should be complicated. There is a gap in wave v of wave 3, which price needs to correct to. A price usually drops or rises to fill a gap, however price still has to correct to the gap of July 24. Note that a JM Internal Band buy signal was given on June 14, 2013, and is still effective. A JM Internal band is a 15-period simple moving average offset by 2% positive and 2% negative. A buy signal is given when the closing price is above the upper band, and a sell signal is given when the price closes below the lower band. A JM Internal band sell signal was given on August 15, 2013 but a new buy signal was given on August 23, 2013. I would only be a buyer of FB on a correction. The WAVE III target of $62.34 looks tempting. However, the RSI divergence sell that is developing bears watching. |
Has been a technical analyst since 1969, and has worked as a futures and options trader with First Financial Futures in Johannesburg, South Africa.
| Address: | 3256 West 24th Ave |
| Vancouver, BC | |
| Phone # for sales: | 6042634214 |
| E-mail address: | petroosp@gmail.com |
Click here for more information about our publications!
Comments

Request Information From Our Sponsors
- StockCharts.com, Inc.
- Candle Patterns
- Candlestick Charting Explained
- Intermarket Technical Analysis
- John Murphy on Chart Analysis
- John Murphy's Chart Pattern Recognition
- John Murphy's Market Message
- MurphyExplainsMarketAnalysis-Intermarket Analysis
- MurphyExplainsMarketAnalysis-Visual Analysis
- StockCharts.com
- Technical Analysis of the Financial Markets
- The Visual Investor
- VectorVest, Inc.
- Executive Premier Workshop
- One-Day Options Course
- OptionsPro
- Retirement Income Workshop
- Sure-Fire Trading Systems (VectorVest, Inc.)
- Trading as a Business Workshop
- VectorVest 7 EOD
- VectorVest 7 RealTime/IntraDay
- VectorVest AutoTester
- VectorVest Educational Services
- VectorVest OnLine
- VectorVest Options Analyzer
- VectorVest ProGraphics v6.0
- VectorVest ProTrader 7
- VectorVest RealTime Derby Tool
- VectorVest Simulator
- VectorVest Variator
- VectorVest Watchdog
