

HOT TOPICS LIST
- MACD
- Fibonacci
- RSI
- Gann
- ADXR
- Stochastics
- Volume
- Triangles
- Futures
- Cycles
- Volatility
- ZIGZAG
- MESA
- Retracement
- Aroon
INDICATORS LIST
LIST OF TOPICS
PRINT THIS ARTICLE
by Andrew Hetherington
In my recent article "The Dow Explanation" (July 26, 2002), I discussed the last drop on the Dow and how the bounce up and inevitable drop down once again would unfold. It's been two months and we are pretty much at the point I expected.
Position: N/A
Andrew Hetherington
Classic Dow Theorist who trades as a pure technician, using pattern recognition.
PRINT THIS ARTICLE
CHART ANALYSIS
The Dow Update!
09/25/02 03:19:35 PMby Andrew Hetherington
In my recent article "The Dow Explanation" (July 26, 2002), I discussed the last drop on the Dow and how the bounce up and inevitable drop down once again would unfold. It's been two months and we are pretty much at the point I expected.
Position: N/A
| As I hypothesized, the 8900 line held strong. I suggested that the ensuing rally would not go beyond 8900, and although it went as high as 9129 intraday, I consider that to be within the limits of the 3% margin of error. The rally up was fast and petered out just as quickly. After the wedge broke to the downside, from 9129 to 8173, the usual pullback to the line ensued. This pullback ended in the 8767 area, which helped form a symmetrical triangle on the second half of a head and shoulders top pattern. This common occurrence allows me to correctly identify the head and shoulders breakdown to follow. The volume was the key to correctly piecing the puzzle together, and it continually diminished throughout the creation of these patterns. The up sloping neckline in the 8200 area was broken on September 18. |
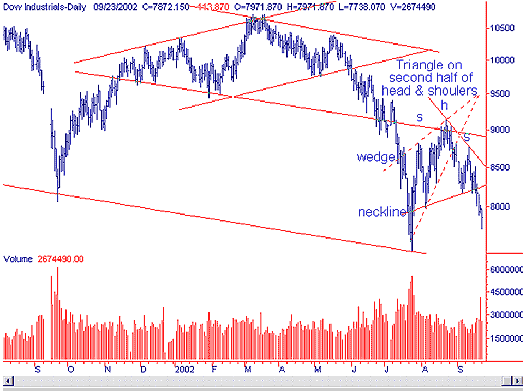 Figure 1: Chart of the Dow Industrials -Daily. During this rally the Dow had fashioned a rising wedge pattern with excellent volume. Many with experience had initially identified these patterns as ascending triangles. They formed on many of the major indices. Unfortunately, the breakouts that confirmed these patterns didn't materialize with any volume. |
|
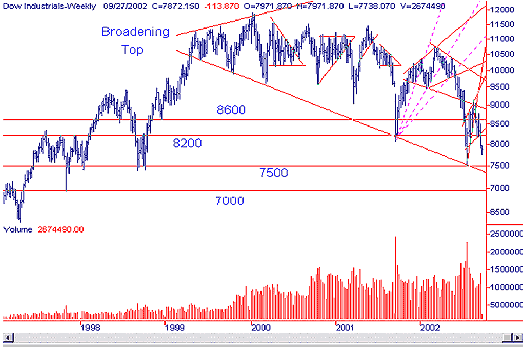
| Figure 2: Dow Industrials - weekly. |
| Graphic provided by: SuperCharts. |
| |
| Where are we headed? As previously mentioned, Dow 5800 is on the horizon. It may not be at this moment but it will happen eventually. The long-term trend is down and was broken not long ago. Currently, we are awaiting a "bounce" up towards the neckline in the 8200-8300 areas. If it happens, the prudent trade once again is to short the Dow. This inevitable pullback will give another opportunity to the short-term speculator. The previous bottom of 7489 will not hold for long if at all. It may hesitate in this area for a day or two but won't hold. My line for the broadening top is in the 7300 area and the next stop after that is 7000. After the pullback, the ensuing drop should see 7300 and this will be a place to watch for yet another small bounce. If this line is breached then the 7000 supports I discussed previously will be in play. Naturally, if it drops hard it is common sense to buy back your short positions since the laws of supply and demand will be at work. Always buy back your short positions on the hard drops and you will stay out of trouble. |
Classic Dow Theorist who trades as a pure technician, using pattern recognition.
| Toronto, Canada |
Click here for more information about our publications!
Comments
Date:�09/25/02Rank:�5Comment:�
Date:�09/26/02Rank:�5Comment:�
Date:�09/29/02Rank:�5Comment:�
Date:�09/29/02Rank:�5Comment:�
Date:�10/02/02Rank:�4Comment:�
Date:�10/02/02Rank:�5Comment:�Andrew: I never saw this before now; thanks
Wally Lowe
Halifax

Request Information From Our Sponsors
- StockCharts.com, Inc.
- Candle Patterns
- Candlestick Charting Explained
- Intermarket Technical Analysis
- John Murphy on Chart Analysis
- John Murphy's Chart Pattern Recognition
- John Murphy's Market Message
- MurphyExplainsMarketAnalysis-Intermarket Analysis
- MurphyExplainsMarketAnalysis-Visual Analysis
- StockCharts.com
- Technical Analysis of the Financial Markets
- The Visual Investor
- VectorVest, Inc.
- Executive Premier Workshop
- One-Day Options Course
- OptionsPro
- Retirement Income Workshop
- Sure-Fire Trading Systems (VectorVest, Inc.)
- Trading as a Business Workshop
- VectorVest 7 EOD
- VectorVest 7 RealTime/IntraDay
- VectorVest AutoTester
- VectorVest Educational Services
- VectorVest OnLine
- VectorVest Options Analyzer
- VectorVest ProGraphics v6.0
- VectorVest ProTrader 7
- VectorVest RealTime Derby Tool
- VectorVest Simulator
- VectorVest Variator
- VectorVest Watchdog