

HOT TOPICS LIST
- MACD
- Fibonacci
- RSI
- Gann
- ADXR
- Stochastics
- Volume
- Triangles
- Futures
- Cycles
- Volatility
- ZIGZAG
- MESA
- Retracement
- Aroon
INDICATORS LIST
LIST OF TOPICS
PRINT THIS ARTICLE
by Matt Blackman
In my article "Is It Time To Sell Netflix?" I made the case for selling Netflix. The trade didn't work out as the stock defied a sky-high valuation, falling earnings in the past year, and a bearish chart pattern to power higher. How much more room is there for this stock to run?
Position: N/A
Matt Blackman
Matt Blackman is a full-time technical and financial writer and trader. He produces corporate and financial newsletters, and assists clients in getting published in the mainstream media. He is the host of TradeSystemGuru.com. Matt has earned the Chartered Market Technician (CMT) designation. Find out what stocks and futures Matt is watching on Twitter at www.twitter.com/RatioTrade
PRINT THIS ARTICLE
CHANNEL LINES
What's Next For Netflix?
10/23/13 02:30:33 PMby Matt Blackman
In my article "Is It Time To Sell Netflix?" I made the case for selling Netflix. The trade didn't work out as the stock defied a sky-high valuation, falling earnings in the past year, and a bearish chart pattern to power higher. How much more room is there for this stock to run?
Position: N/A
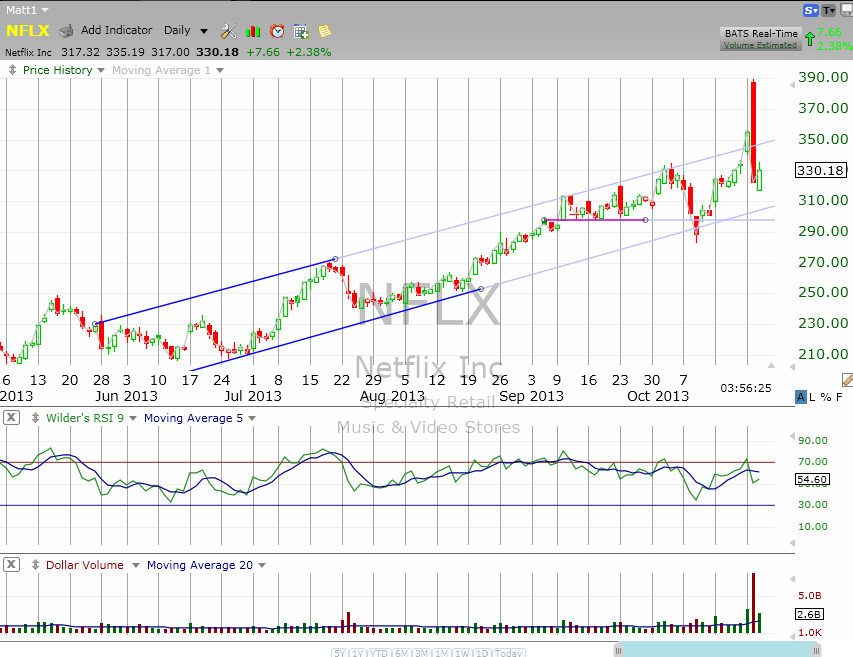
| On Monday, October 21, 2013 Netflix reported Q3-13 results and beat with earnings of $0.52/share versus the expectation of $0.47. Many were expecting disappointing results to drive the stock lower but that just didn't happen. But the stock performance, which was labeled "crazy bananas" by one analyst interviewed on Bloomberg, continued to power higher, closing up by more than 6.4% to close at $354.9/share. It soared to $389.16 on Tuesday before experiencing a strong sell-off to close at $322.52. So how much more upside is there for this stock? |
|
| Figure 1 � Daily chart of Netflix (NFLX) showing the recent break above the trading channel and bearish engulfing candle on October 22, 2013. |
| Graphic provided by: TC2000.com. |
| |
| According to data from TC2000.com, before the most recent report earnings, Q2 earnings were up 276% but were down 56% in the last year with the company sporting a PE north of 400. This compares to a more modest PE of 27 for tech giant Google and 12.5 for Apple. But regardless, the stock has defied the naysayers and extreme fundamentals to continue to attract buyers and like Tesla, it has been hard on short sellers. The company now boasts more than 40 million subscribers worldwide. |
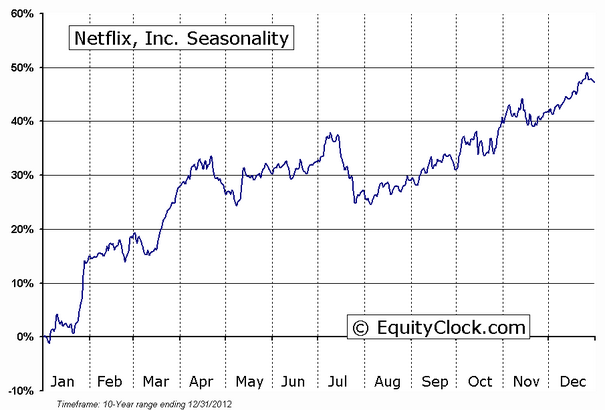
| One big point in the plus column for the stock is the positive seasonal influences this time of year. As Figure 2 shows, the fall and early spring have been good times to own the stock with the stock typically experiencing a pre-Christmas rush of nearly 10% followed by another 30% pop from early January to mid-April over the past 10 years. |
|
| Figure 2 � Seasonal composite chart over the last 10 years for Netflix showing periods of weakness but and strength through the calendar year. |
| Graphic provided by: www.EquityClock.com. |
| |
| So when would be a good time to buy? NFLX experienced a "sell the news" drop but as long as support holds around $298 it could resume its uptrend channel assuming the market doesn't weaken overall. Assuming bullishness holds, there is a chance the stock will use the most recent earnings report to attract more buyers and head towards $400. |
| A big caveat is the historic "crazy bananas" price movement. Stops are a must at all times when playing this highly volatile stock. |
Matt Blackman is a full-time technical and financial writer and trader. He produces corporate and financial newsletters, and assists clients in getting published in the mainstream media. He is the host of TradeSystemGuru.com. Matt has earned the Chartered Market Technician (CMT) designation. Find out what stocks and futures Matt is watching on Twitter at www.twitter.com/RatioTrade
| Company: | TradeSystemGuru.com |
| Address: | Box 2589 |
| Garibaldi Highlands, BC Canada | |
| Phone # for sales: | 604-898-9069 |
| Fax: | 604-898-9069 |
| Website: | www.tradesystemguru.com |
| E-mail address: | indextradermb@gmail.com |
Traders' Resource Links | |
| TradeSystemGuru.com has not added any product or service information to TRADERS' RESOURCE. | |
Click here for more information about our publications!
Comments
Date:�10/23/13Rank:�4Comment:�

Request Information From Our Sponsors
- VectorVest, Inc.
- Executive Premier Workshop
- One-Day Options Course
- OptionsPro
- Retirement Income Workshop
- Sure-Fire Trading Systems (VectorVest, Inc.)
- Trading as a Business Workshop
- VectorVest 7 EOD
- VectorVest 7 RealTime/IntraDay
- VectorVest AutoTester
- VectorVest Educational Services
- VectorVest OnLine
- VectorVest Options Analyzer
- VectorVest ProGraphics v6.0
- VectorVest ProTrader 7
- VectorVest RealTime Derby Tool
- VectorVest Simulator
- VectorVest Variator
- VectorVest Watchdog
- StockCharts.com, Inc.
- Candle Patterns
- Candlestick Charting Explained
- Intermarket Technical Analysis
- John Murphy on Chart Analysis
- John Murphy's Chart Pattern Recognition
- John Murphy's Market Message
- MurphyExplainsMarketAnalysis-Intermarket Analysis
- MurphyExplainsMarketAnalysis-Visual Analysis
- StockCharts.com
- Technical Analysis of the Financial Markets
- The Visual Investor