

HOT TOPICS LIST
- MACD
- Fibonacci
- RSI
- Gann
- ADXR
- Stochastics
- Volume
- Triangles
- Futures
- Cycles
- Volatility
- ZIGZAG
- MESA
- Retracement
- Aroon
INDICATORS LIST
LIST OF TOPICS
PRINT THIS ARTICLE
by Matt Blackman
At the beginning of 2013, Netflix was selling for $92/share. By September it had surged through $300. But the stock has generated a bearish pattern. Is it time to sell?
Position: Sell
Matt Blackman
Matt Blackman is a full-time technical and financial writer and trader. He produces corporate and financial newsletters, and assists clients in getting published in the mainstream media. He is the host of TradeSystemGuru.com. Matt has earned the Chartered Market Technician (CMT) designation. Find out what stocks and futures Matt is watching on Twitter at www.twitter.com/RatioTrade
PRINT THIS ARTICLE
BULL/BEAR MARKET
Is It Time to Sell Netflix?
09/27/13 04:35:13 PMby Matt Blackman
At the beginning of 2013, Netflix was selling for $92/share. By September it had surged through $300. But the stock has generated a bearish pattern. Is it time to sell?
Position: Sell
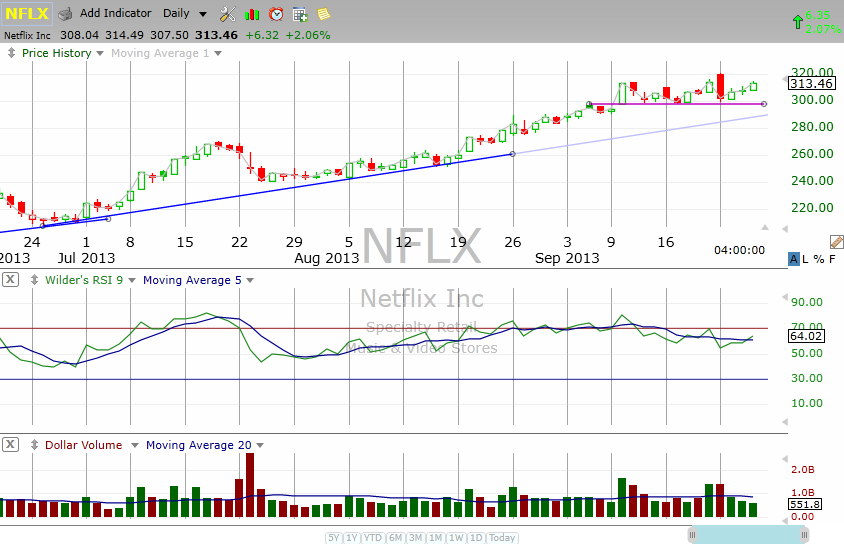
| In July 2011 after an incredible run, NFLX briefly touched $300 before falling off a cliff. By September 2012, the stock was trading at around one-sixth of its prior high in the $54 range. It's been a roller coaster ride since, as Figure 2 shows. But traders can't ignore the bearish engulfing bear candlestick pattern that the stock posted September 23, 2013. For those who don't use candles, NFLX also generated a key reversal bar. A key reversal bar is generated when the stock meets three requirements. First it must open above the prior daily close. Second, it must post a new high. Finally, the stock must close below the prior day's low. More importantly for NFLX is that when we see a bearish engulfing or key reversal in an uptrend, it often signals the end of the trend. |
|
| Figure 1 � Daily chart of Netflix since April 2013 showing the key reversal day (Bearish Engulfing Candle) on the right-hand side of the chart. |
| Graphic provided by: TC2000.com. |
| |
| What is interesting is that Netflix won its first Emmy award on September 22, which traders appear to be using to sell the stock. The only other reasons I could find for the drop other than a buy the rumor, sell the news approach was a Comtex report on September 23 that singled out NFLX as having the highest debt to EBITDA (Earnings Before Interest, Taxes, Depreciation and Amortization) of 5.4 times than any other stock in the Internet Retail industry. Another concern is the sky high valuation with a PE of 385. NFLX saw earning increase 345% in the latest quarter but earnings are down on a year-over-year basis. |
|
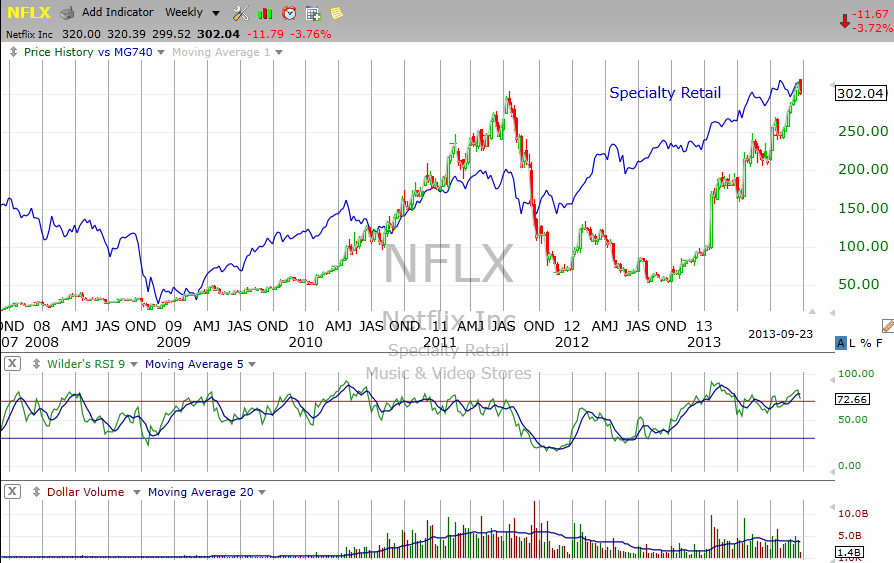
| Figure 2 � Weekly chart of Netflix showing the volatility compared to its industry. |
| Graphic provided by: TC2000.com. |
| |
|
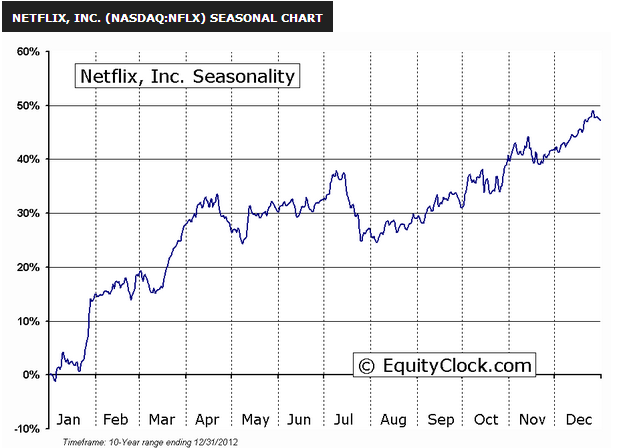
| Figure 3 � Composite chart of NFLX over the last 10 years showing periods of strength and weakness and the incredible average annual appreciation in the stock. |
| Graphic provided by: www.EquityClock.com. |
| |
| With earnings growing in the last quarter and other than the high debt to earnings ratio, there are no real compelling fundamental reasons to sell the stock. But then again as any trader worth his or her salt knows, by the time earnings become a real concern to investors, the stock has usually already fallen out of bed. |
| As is usually the case, traders use technicals to tell them when to get into, or in this case, out of the stock before the fundamental investors realize there is a problem. |
Matt Blackman is a full-time technical and financial writer and trader. He produces corporate and financial newsletters, and assists clients in getting published in the mainstream media. He is the host of TradeSystemGuru.com. Matt has earned the Chartered Market Technician (CMT) designation. Find out what stocks and futures Matt is watching on Twitter at www.twitter.com/RatioTrade
| Company: | TradeSystemGuru.com |
| Address: | Box 2589 |
| Garibaldi Highlands, BC Canada | |
| Phone # for sales: | 604-898-9069 |
| Fax: | 604-898-9069 |
| Website: | www.tradesystemguru.com |
| E-mail address: | indextradermb@gmail.com |
Traders' Resource Links | |
| TradeSystemGuru.com has not added any product or service information to TRADERS' RESOURCE. | |
Click here for more information about our publications!
Comments

Request Information From Our Sponsors
- StockCharts.com, Inc.
- Candle Patterns
- Candlestick Charting Explained
- Intermarket Technical Analysis
- John Murphy on Chart Analysis
- John Murphy's Chart Pattern Recognition
- John Murphy's Market Message
- MurphyExplainsMarketAnalysis-Intermarket Analysis
- MurphyExplainsMarketAnalysis-Visual Analysis
- StockCharts.com
- Technical Analysis of the Financial Markets
- The Visual Investor
- VectorVest, Inc.
- Executive Premier Workshop
- One-Day Options Course
- OptionsPro
- Retirement Income Workshop
- Sure-Fire Trading Systems (VectorVest, Inc.)
- Trading as a Business Workshop
- VectorVest 7 EOD
- VectorVest 7 RealTime/IntraDay
- VectorVest AutoTester
- VectorVest Educational Services
- VectorVest OnLine
- VectorVest Options Analyzer
- VectorVest ProGraphics v6.0
- VectorVest ProTrader 7
- VectorVest RealTime Derby Tool
- VectorVest Simulator
- VectorVest Variator
- VectorVest Watchdog