

HOT TOPICS LIST
- MACD
- Fibonacci
- RSI
- Gann
- ADXR
- Stochastics
- Volume
- Triangles
- Futures
- Cycles
- Volatility
- ZIGZAG
- MESA
- Retracement
- Aroon
INDICATORS LIST
LIST OF TOPICS
PRINT THIS ARTICLE
by Matt Blackman
Recently oil has shown signs of a top. But perhaps the larger question traders should be asking is what do falling oil prices mean for stocks?
Position: N/A
Matt Blackman
Matt Blackman is a full-time technical and financial writer and trader. He produces corporate and financial newsletters, and assists clients in getting published in the mainstream media. He is the host of TradeSystemGuru.com. Matt has earned the Chartered Market Technician (CMT) designation. Find out what stocks and futures Matt is watching on Twitter at www.twitter.com/RatioTrade
PRINT THIS ARTICLE
HEAD & SHOULDERS
Is Oil Headed For The Dumps?
10/24/13 05:00:42 PMby Matt Blackman
Recently oil has shown signs of a top. But perhaps the larger question traders should be asking is what do falling oil prices mean for stocks?
Position: N/A
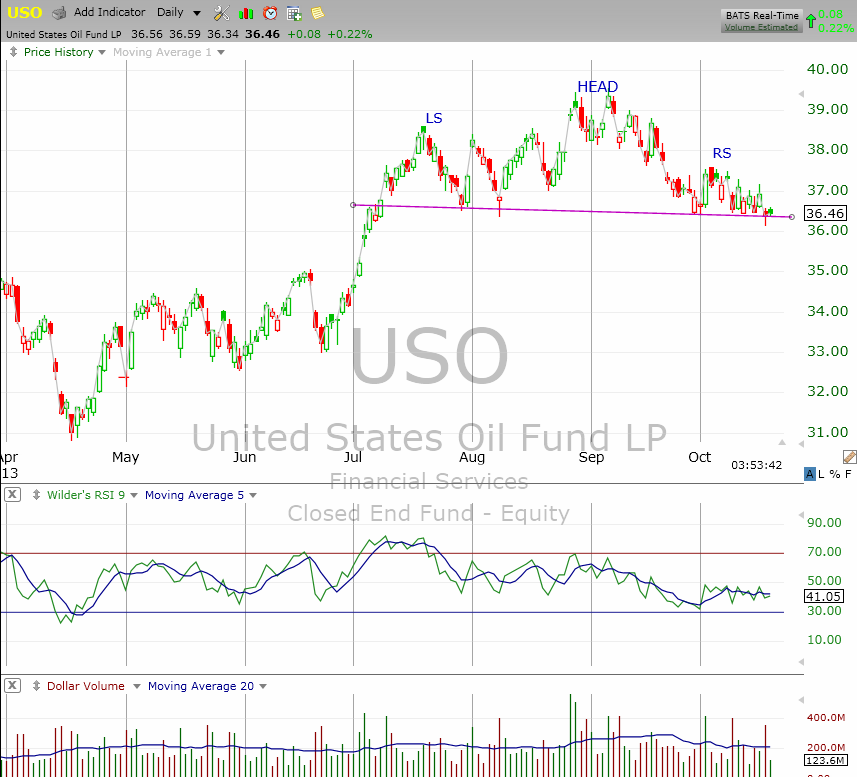
| With the latest Congressional crisis averted until the New Year, stocks resumed their mercurial rise fueled by the promise of continued quantitative easing (QE) for the foreseeable future thanks to a weaker economy. But this promise has provided no lift for oil prices. As Figure 1 shows, the U.S. Oil Fund LP (USO), which allows stock traders to make bets on oil prices, has been flashing a bearish head & shoulders pattern with a downward sloping neckline. |
|
| Figure 1 � Daily chart of the U.S. Oil Fund LP (USO) showing the Head & Shoulders topping pattern that began in July and looked ready to confirm in late October. |
| Graphic provided by: TC2000.com. |
| |
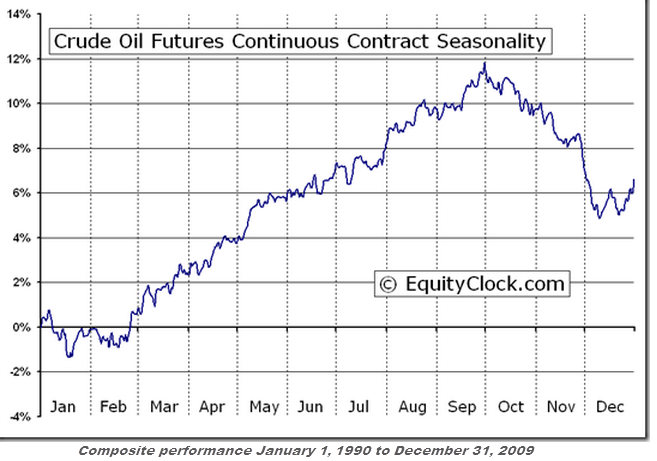
| When crude oil peaked at its all-time high in July 2008, stock prices had been falling for nine months. For a month after oil peaked, the stock market mounted a short rally which failed a month later in August. Over the next seven months, the S&P500 lost more than 600 points before bottoming in March 2009. If the H&S pattern on USO is breached, it has bearish implications for stocks. And given the seasonality of oil — the fall has typically been a good time to sell the slippery but essential commodity — there is a good chance that the H&S pattern in Figure 1 will be confirmed. Over the last 20 years, crude has shown a tendency to peak in early October and drop around seven percent into December (Figure 2). |
|
| Figure 2 � Composite chart of crude oil (CL) from EquityClock.com showing periods of seasonal strength and weakness. |
| Graphic provided by: EquityClock.com. |
| |
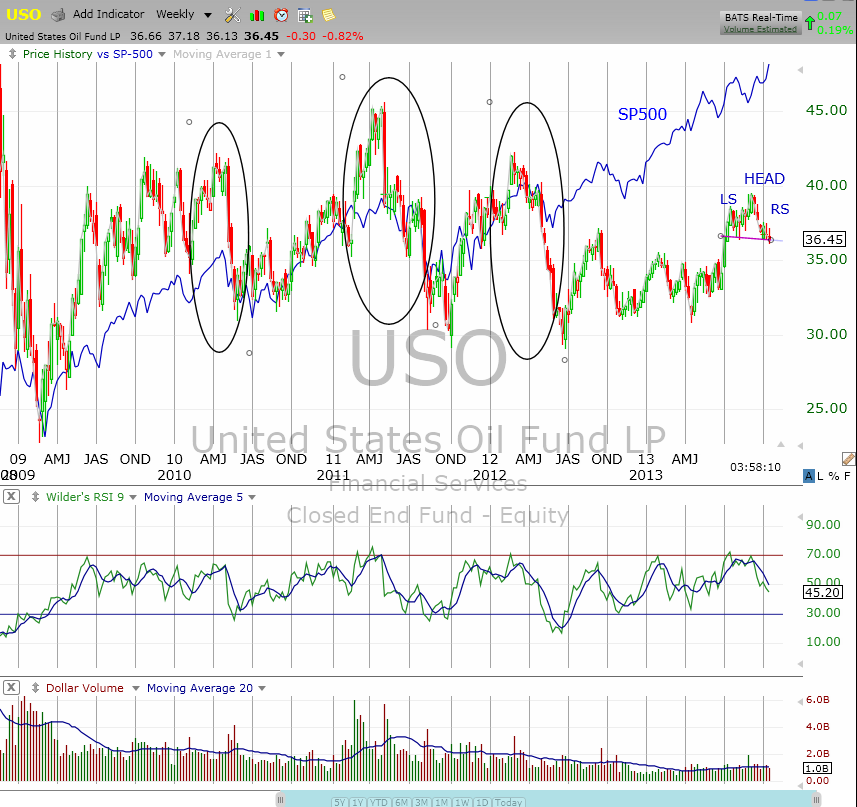
| As Figure 3 shows, each USO peak since 2009 has either led or coincided with a peak in the S&P 500. Translation: falling oil prices may be good for the economy but they have been mostly negative for stocks. |
|
| Figure 3 � Weekly chart of USO versus the S&P 500 showing peaks in oil prices followed by peaks in stock prices. |
| Graphic provided by: TC2000.com. |
| |
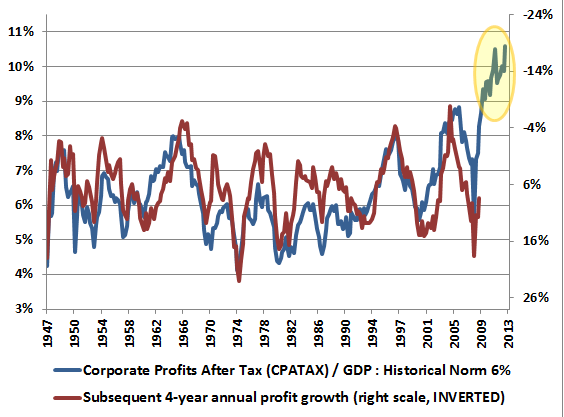
| There have been a number of stock market topping signs flashing since February (see article "More Stock Market Topping Signs"). Another one is corporate after-tax profits which recently hit a new all-time record high. Figure 4 comparing after-tax corporate profits with subsequent four-year annual profit growth shows that if the relationship continues, markets will be faced to deal with falling corporate profitability through 2017. (For more on this please click here) Yet the hope for QE infinity continues to fuel unbridled investor bullishness. |
|
| Figure 4 � Chart showing the correlation between after-tax corporate profitability with subsequent 4-year annual profit growth. |
| Graphic provided by: http://www.hussmanfunds.com/wmc/wmc130923.htm. |
| |
| The difficult part will be in knowing when to exit and take profits. But one thing is sure; The higher stock prices go, the more they will have to fall when the inevitable correction comes. |
Matt Blackman is a full-time technical and financial writer and trader. He produces corporate and financial newsletters, and assists clients in getting published in the mainstream media. He is the host of TradeSystemGuru.com. Matt has earned the Chartered Market Technician (CMT) designation. Find out what stocks and futures Matt is watching on Twitter at www.twitter.com/RatioTrade
| Company: | TradeSystemGuru.com |
| Address: | Box 2589 |
| Garibaldi Highlands, BC Canada | |
| Phone # for sales: | 604-898-9069 |
| Fax: | 604-898-9069 |
| Website: | www.tradesystemguru.com |
| E-mail address: | indextradermb@gmail.com |
Traders' Resource Links | |
| TradeSystemGuru.com has not added any product or service information to TRADERS' RESOURCE. | |
Click here for more information about our publications!
Comments
Date:�10/26/13Rank:�3Comment:�

Request Information From Our Sponsors
- StockCharts.com, Inc.
- Candle Patterns
- Candlestick Charting Explained
- Intermarket Technical Analysis
- John Murphy on Chart Analysis
- John Murphy's Chart Pattern Recognition
- John Murphy's Market Message
- MurphyExplainsMarketAnalysis-Intermarket Analysis
- MurphyExplainsMarketAnalysis-Visual Analysis
- StockCharts.com
- Technical Analysis of the Financial Markets
- The Visual Investor
- VectorVest, Inc.
- Executive Premier Workshop
- One-Day Options Course
- OptionsPro
- Retirement Income Workshop
- Sure-Fire Trading Systems (VectorVest, Inc.)
- Trading as a Business Workshop
- VectorVest 7 EOD
- VectorVest 7 RealTime/IntraDay
- VectorVest AutoTester
- VectorVest Educational Services
- VectorVest OnLine
- VectorVest Options Analyzer
- VectorVest ProGraphics v6.0
- VectorVest ProTrader 7
- VectorVest RealTime Derby Tool
- VectorVest Simulator
- VectorVest Variator
- VectorVest Watchdog