

HOT TOPICS LIST
- MACD
- Fibonacci
- RSI
- Gann
- ADXR
- Stochastics
- Volume
- Triangles
- Futures
- Cycles
- Volatility
- ZIGZAG
- MESA
- Retracement
- Aroon
INDICATORS LIST
LIST OF TOPICS
PRINT THIS ARTICLE
by Donald W. Pendergast, Jr.
Shares of Chevron Corp. (CVX) are being pulled higher by a strong short-covering rally after a major price pattern completes.
Position: N/A
Donald W. Pendergast, Jr.
Freelance financial markets writer and online publisher of the Trendzetterz.com S&P 500 Weekly Forecast service.
PRINT THIS ARTICLE
REVERSAL
Chevron: Selloff Completed, Rally In Effect
10/15/13 02:58:05 PMby Donald W. Pendergast, Jr.
Shares of Chevron Corp. (CVX) are being pulled higher by a strong short-covering rally after a major price pattern completes.
Position: N/A
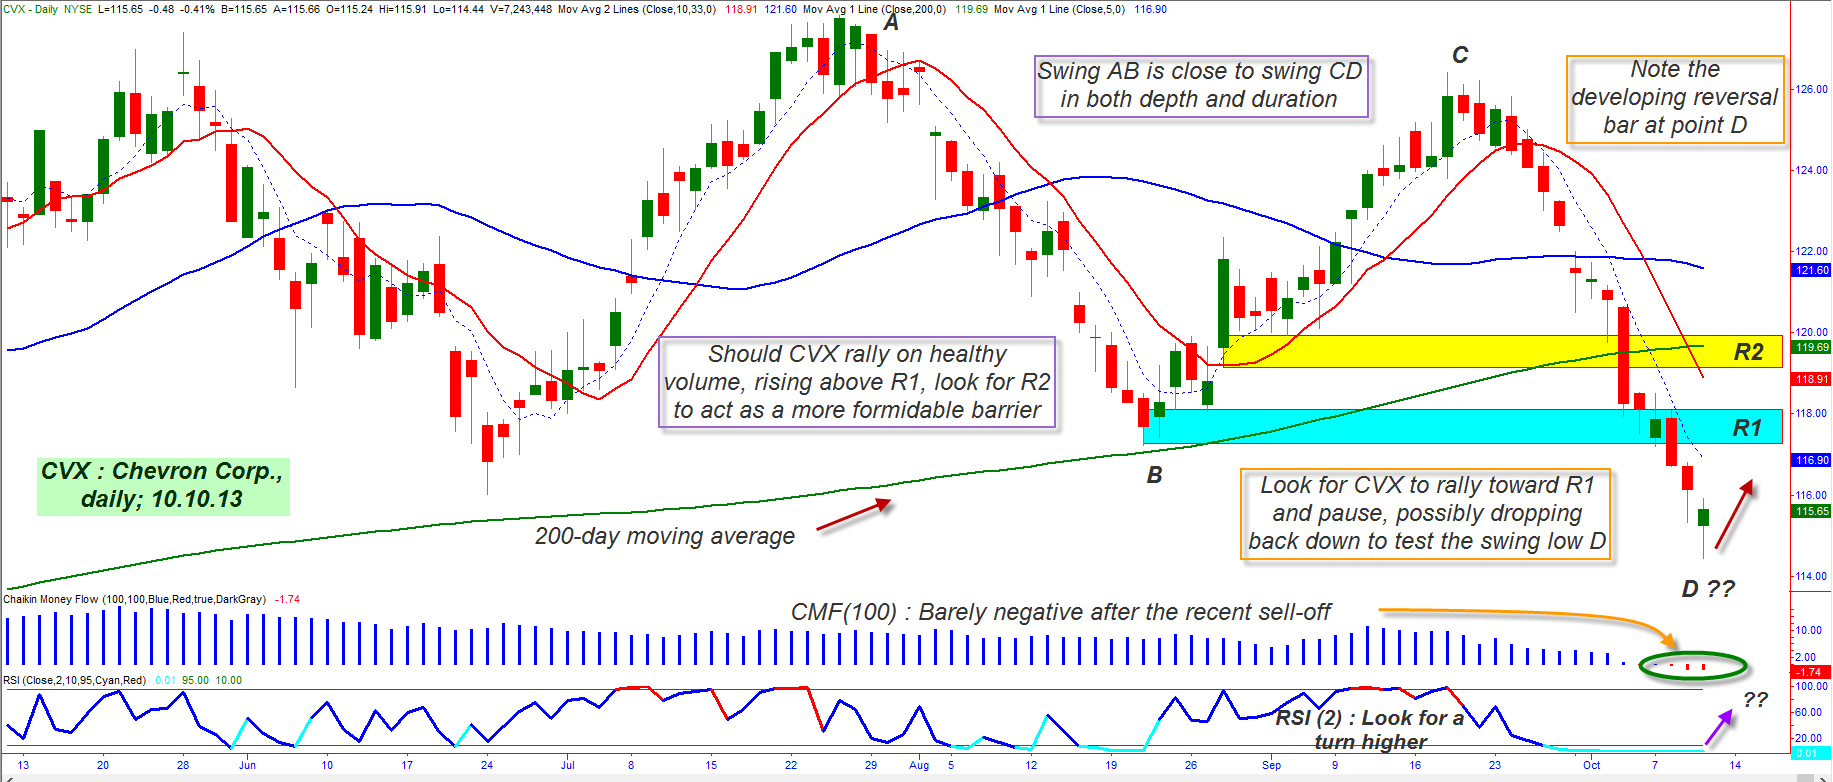
| Shares of Chevron Corp. (CVX) staged a notable bullish reversal, along with major US stock indexes. The technical indicators look supportive enough for the stock to continue this latest swing move, but how much ground can the stock make before it corrects again? Here's a closer look at CVX's daily chart (Figure 1). |
|
| Figure 1. Shares of Chevron Corp. (CVX) appear to have enough in the way of long-term money flow support and broad market strength to allow it to run higher in the next week or two, with its R1 zone the most likely achieved target. |
| Graphic provided by: TradeStation. |
| |
| Since April 2013, CVX has been making some of the most tradable, well-proportioned swing moves imaginable — on a variety of time frames — and offering skilled swing traders numerous opportunities to capitalize on the moves for weeks at a time on its daily time frame. In fact the last four completed swings — XA, AB, BC and CD have all been remarkably similar in terms of point moves/percentage moves, with swings AB and CD being of most interest right now. Here are the stats for those two moves: * AB point move = 10.61 * AB percent move = -8.30% * CD point move = 11.99 * CD percent move = -9.48% Swing CD was marginally deeper and took 22 days to complete, whereas swing AB took 27 days to travel top to bottom; this means that the selling pressure was indeed heavier on swing CD. You'll note that while AB was terminated when it met up with the 200-day moving average, swing CD dipped well below the average, creating a new and more bearish trend dynamic for this key integrated oil stock. Meanwhile, the long term money flow trend has finally gone beneath its zero line for the first time since February 2013 and that the 2-day RSI is now at its lowest possible reading of .01. Additionally, as the broad markets have begun to turn higher — as I suggested was a high-probability event in my previous TCA post — CVX is forming a bullish reversal candle on its daily chart. How to interpret all of this? Here's the most likely scenario for CVX over the next week or two: A. With CVX technically in a bear market (trading below its 200-day moving average), one possibility is that the stock manages to bounce back up toward the underside of that moving average before turning sharply lower again; if CVX has strength enough to push into the yellow shaded R2 (resistance #2) zone, look for signs of exhaustion and price/momentum divergence on a smaller time frame and then prepare to go short once again. If the Dow 30 (DIA) makes it up toward 152.00 to 153.00 and also stalls out, you'll have additional broad market confirmation of a stall-out. Remember, the medium-term outlook for the major US stock indexes is for a more sustained correction, and that should pull all large caps like CVX well below the October 9 lows. B. If the broad markets peter out even sooner, with the Dow 300 struggling to even hit 152.00, look to see if CVX is stalling out near its R1 level, especially on its hourly (60 minute) chart; this could be a sign that the current rally is simply a short-covering event prior to a fast move back down to test the October 9 lows. |
|
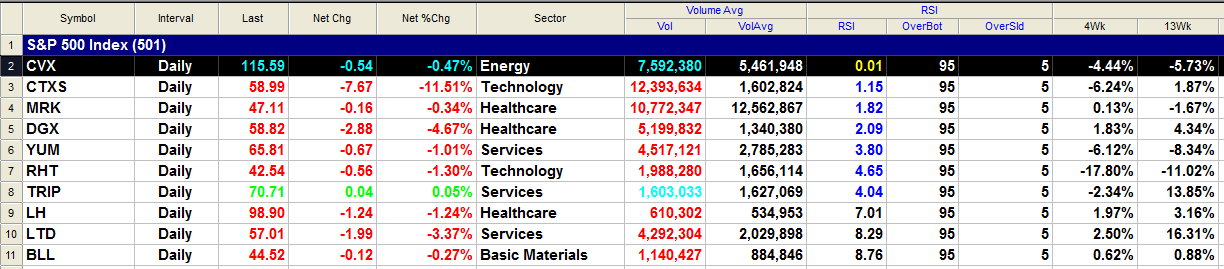
| Figure 2. CVX has the lowest possible 2-day RSI reading of all S&P 500 stocks as of this writing. Some of the other large caps shown may also be ready to move higher with the S&P 500 index (.SPX) as a whole. |
| Graphic provided by: TradeStation. |
| Graphic provided by: TradeSattion RadarScreen. |
| |
| Playing CVX on the long side here might best be done by selling an October '13 CVX $115.00 put option; this put has more than 14,200 contracts in open interest and also has an excellent bid/ask spread. The idea here is to sell the put if CVX rises above the October 10 high of 116.38, hoping for a fast run up into at least the upper R1 zone (close to 118.00) and then buying the put back as CVX rallies. By no means allow the option to increase in value by more than 60% and immediately repurchase it if you see that CVX is stalling and reversing lower before it hits the R1 zone. More aggressive traders could attempt to sell half their position in the R1 zone and then the other half in or near the R2 zone, but that carries far more risk — with greater potential reward, too. Account risk should be kept at 1% maximum, no matter how bullish you may be on CVX at this time; trade wisely until we meet here again. |
Freelance financial markets writer and online publisher of the Trendzetterz.com S&P 500 Weekly Forecast service.
| Title: | Market consultant and writer |
| Company: | Trendzetterz |
| Address: | 81 Hickory Hollow Drive |
| Crossville, TN 38555 | |
| Phone # for sales: | 904-303-4814 |
| Website: | trendzetterz.com |
| E-mail address: | support@trendzetterz.com |
Traders' Resource Links | |
| Trendzetterz has not added any product or service information to TRADERS' RESOURCE. | |
Click here for more information about our publications!
Comments

Request Information From Our Sponsors
- StockCharts.com, Inc.
- Candle Patterns
- Candlestick Charting Explained
- Intermarket Technical Analysis
- John Murphy on Chart Analysis
- John Murphy's Chart Pattern Recognition
- John Murphy's Market Message
- MurphyExplainsMarketAnalysis-Intermarket Analysis
- MurphyExplainsMarketAnalysis-Visual Analysis
- StockCharts.com
- Technical Analysis of the Financial Markets
- The Visual Investor
- VectorVest, Inc.
- Executive Premier Workshop
- One-Day Options Course
- OptionsPro
- Retirement Income Workshop
- Sure-Fire Trading Systems (VectorVest, Inc.)
- Trading as a Business Workshop
- VectorVest 7 EOD
- VectorVest 7 RealTime/IntraDay
- VectorVest AutoTester
- VectorVest Educational Services
- VectorVest OnLine
- VectorVest Options Analyzer
- VectorVest ProGraphics v6.0
- VectorVest ProTrader 7
- VectorVest RealTime Derby Tool
- VectorVest Simulator
- VectorVest Variator
- VectorVest Watchdog