

HOT TOPICS LIST
- MACD
- Fibonacci
- RSI
- Gann
- ADXR
- Stochastics
- Volume
- Triangles
- Futures
- Cycles
- Volatility
- ZIGZAG
- MESA
- Retracement
- Aroon
INDICATORS LIST
LIST OF TOPICS
PRINT THIS ARTICLE
by Donald W. Pendergast, Jr.
Of all the major US stock indexes, it's the Dow 30 Industrials that has been sold off the most; but a near-term short covering rally is now at hand.
Position: N/A
Donald W. Pendergast, Jr.
Freelance financial markets writer and online publisher of the Trendzetterz.com S&P 500 Weekly Forecast service.
PRINT THIS ARTICLE
SUPPORT & RESISTANCE
DIA: Bullish Reversal Imminent
10/10/13 05:18:09 PMby Donald W. Pendergast, Jr.
Of all the major US stock indexes, it's the Dow 30 Industrials that has been sold off the most; but a near-term short covering rally is now at hand.
Position: N/A
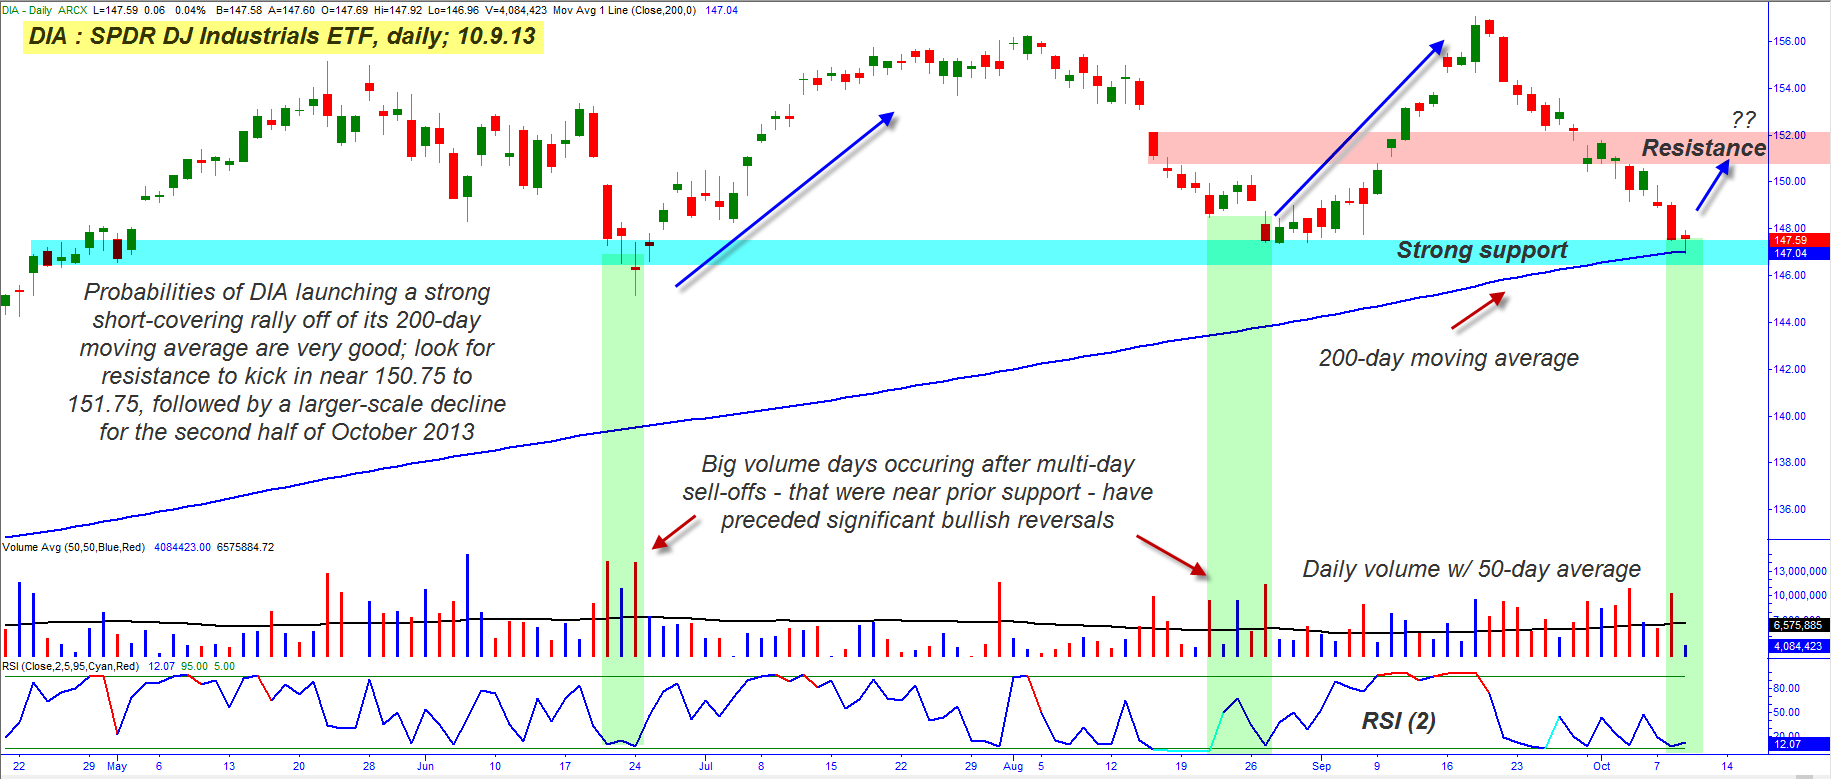
| Since reaching its most recent all-time high on September 18, 2013, the Dow Jones Industrial average (DJIA, DIA, @YM) has fallen by more than 6.4%; while it is true that a larger correction of 25% to 38% of the massive rally since late 2012 November is still likely, for the time being, the Dow is setting up for a very high reward, low risk bullish reversal, one that could last for at least seven to 10 trading days. Here's a closer look now. |
|
| Figure 1. Third time's a charm? The odds are very good for the Dow 30 Industrials to rally back toward 15,100 near-term, but the longer term trend of the market will be toward lower levels once the blue support zone is decisively broken. |
| Graphic provided by: TradeStation. |
| |
| The major US market stock indexes have been on a bullish tear since mid-November 2012, with new all-time highs being made in the small caps (IWM), mid-cap (MDY) and large-cap indexes (SPY, DIA) during the past 11 months; and even though the NASDAQ 100 index (QQQ) is still far shy of its own all-time high — made at the end of the dotcom bubble in 2000 — it too has surged to multiyear highs. Long-term distribution had been underway for many months before mid-September's high in DIA, however, and the recent sell-off was anything but a surprise to sharp market technicians. But at the moment, DIA is showing an extremely high probability for a near-term bullish reversal, as evidenced by the following dynamics on its daily chart (Figure 1): 1. DIA is in process of seeking its latest combined 20- and 40-day cycle low — with the 40-day low not due for another two weeks. 2. The latest sell-off is now reversing higher from the 200-day moving average — almost to the tick — and the daily candle, although not yet completed, is clearly signaling a bullish reversal. 3. The 21- and 34-day Chaikin Money flow histograms (CMF)(21, 34) are in agreement that a bullish divergence with price has formed. 4. The volume on the last wide range down day of the decline (October 8, 2013) was lower than that seen on a previous down day on October 3, 2013. If you look at the August 27, 2013 low — also a down day that helped form a firm cycle low — you'll find that its volume was significantly higher than those of October 3 and 8, 2013. This is suggesting that selling pressure is rapidly drying up and that buyers are preparing to step in to take new long positions again. That yesterday's low was beneath that seen in late August 2013 — but with lower volume into the low — is another clue that a tradable low is either here or fast approaching. 5. The horizontal blue shaded zone shows us where major support is for DIA, and it is important to know that it has implications both for a near-term bounce and for an anticipated larger-degree correction, one that could get ugly once the zone is decisively broken to the downside. 6. Note that the two-day RSI is also hovering down near the 13.00 level; it had been as low as 8.05 as of Tuesday's close. 7. Tuesday's ratio of up NYSE volume/down volume was exceedingly bearish — so much so that it could be termed "overdone" and in line with all the other potentially bullish factors mentioned — and is another high probability clue that a bullish turn is just about here. |
|
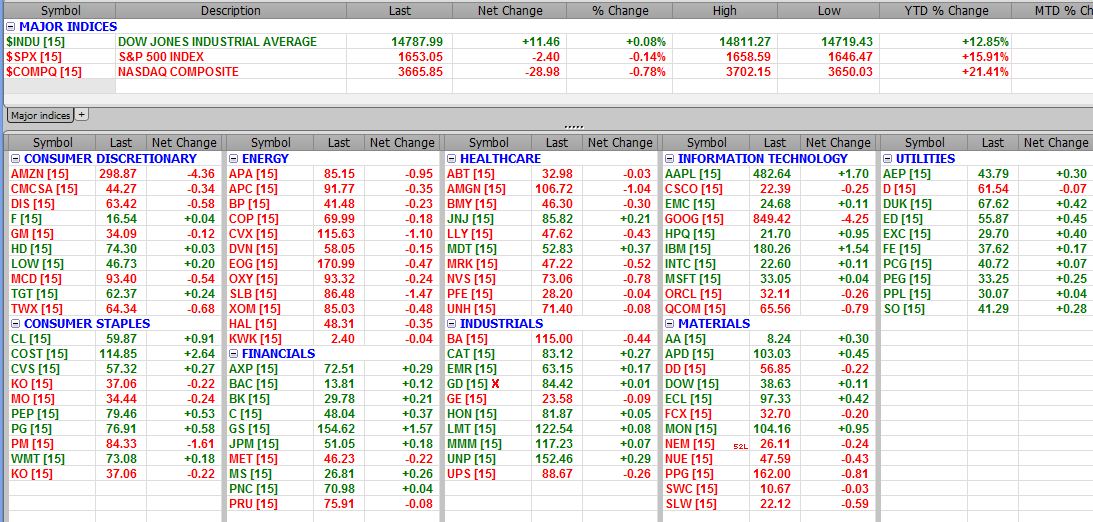
| Figure 2. As DIA bottomed and reversed intraday around 11:25 am ET on October 9, 2013, the financial sector stocks began to turn higher, too, leading the Dow 30 and S&P 500 indexes higher. |
| Graphic provided by: FutureSource.com. |
| |
| Playing this impending bullish turn might be done any number of ways: 1.Buy FAS (Direxion 3x Bullish Financials ETF), looking to capitalize on the strength of financial stocks as they begin to turn higher (see Figure 2), looking to ride a modest swing move as the Dow 30 attempts to break back above 15,000 or even 15,100. 2. Buy UDOW, another 3x leveraged ETF that stands to magnify gains if the Dow follows through with a nice reversal. 3. Sell an out-of-the money put option with a short lifespan; consider selling the October '13 DIA $147.00 put option; this put has only 16 days till expiration and has accelerating time decay working for it now. Bid-ask spreads are good and open interest comes in at 744 contracts. If DIA is destined to follow through with a short-covering rally, all three of these strategies stand to do well over the next week or so, provided that DIA can close above 148.60 within the next couple of sessions. Make sure you keep your account risk for the trade at 1% maximum, being fully aware that this anticipated rally will be short-term in nature, with the dominant longer term trend now likely to be going much lower heading into year end 2013. Trade wisely until we meet here again. |
Freelance financial markets writer and online publisher of the Trendzetterz.com S&P 500 Weekly Forecast service.
| Title: | Market consultant and writer |
| Company: | Trendzetterz |
| Address: | 81 Hickory Hollow Drive |
| Crossville, TN 38555 | |
| Phone # for sales: | 904-303-4814 |
| Website: | trendzetterz.com |
| E-mail address: | support@trendzetterz.com |
Traders' Resource Links | |
| Trendzetterz has not added any product or service information to TRADERS' RESOURCE. | |
Click here for more information about our publications!
Comments
Date:�10/11/13Rank:�4Comment:�Thanks.

Request Information From Our Sponsors
- StockCharts.com, Inc.
- Candle Patterns
- Candlestick Charting Explained
- Intermarket Technical Analysis
- John Murphy on Chart Analysis
- John Murphy's Chart Pattern Recognition
- John Murphy's Market Message
- MurphyExplainsMarketAnalysis-Intermarket Analysis
- MurphyExplainsMarketAnalysis-Visual Analysis
- StockCharts.com
- Technical Analysis of the Financial Markets
- The Visual Investor
- VectorVest, Inc.
- Executive Premier Workshop
- One-Day Options Course
- OptionsPro
- Retirement Income Workshop
- Sure-Fire Trading Systems (VectorVest, Inc.)
- Trading as a Business Workshop
- VectorVest 7 EOD
- VectorVest 7 RealTime/IntraDay
- VectorVest AutoTester
- VectorVest Educational Services
- VectorVest OnLine
- VectorVest Options Analyzer
- VectorVest ProGraphics v6.0
- VectorVest ProTrader 7
- VectorVest RealTime Derby Tool
- VectorVest Simulator
- VectorVest Variator
- VectorVest Watchdog