HOT TOPICS LIST
- MACD
- Fibonacci
- RSI
- Gann
- ADXR
- Stochastics
- Volume
- Triangles
- Futures
- Cycles
- Volatility
- ZIGZAG
- MESA
- Retracement
- Aroon
INDICATORS LIST
LIST OF TOPICS
PRINT THIS ARTICLE
by Jayanthi Gopalakrishnan
Shares of Facebook have been bullish of late. Can we expect a continuation going forward?
Position: Hold
Jayanthi Gopalakrishnan
PRINT THIS ARTICLE
MACD
Facebook Facing Up?
08/30/13 10:33:41 AMby Jayanthi Gopalakrishnan
Shares of Facebook have been bullish of late. Can we expect a continuation going forward?
Position: Hold
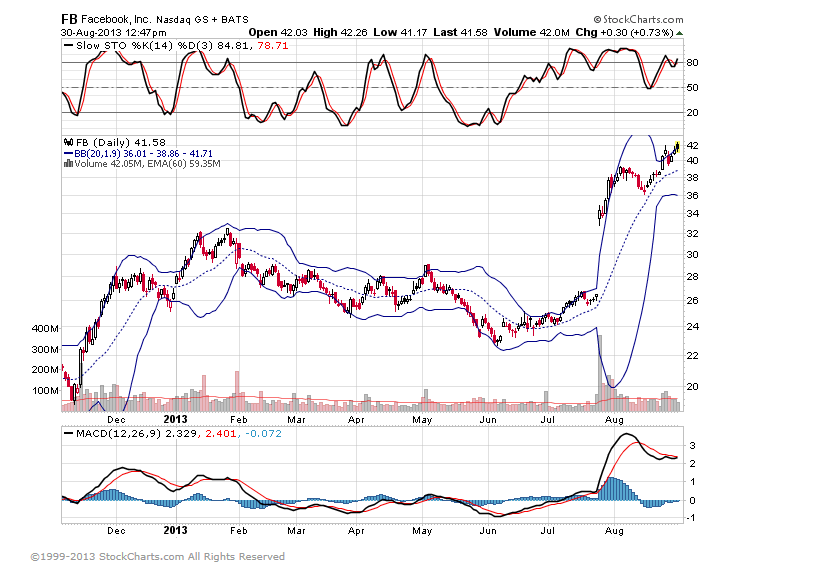
| After the much talked about dismal initial public offering (IPO), shares of Facebook (FB) are finally showing some spark. Those who jumped on board this rally would be considering themselves fortunate. For them, it's a matter of deciding when and where to take profits. |

|
| Figure 1. Daily chart of Facebook (FB) showing that the stock price appears to be approaching overbought levels. |
| Graphic provided by: StockCharts.com. |
| |
| Looking at the chart of FB in Figure 1, it does look as if price is in overbought territory. The slow stochastic is above 80, but has room to move a little higher. The moving average convergence divergence (MACD) shows that the trend could continue higher or it could turn around. And price is still hugging the upper Bollinger Band. There is a chance that price could pullback some time soon. If a pullback was evident, those holding long positions could take partial profits and those who missed the ride could take advantage of this pullback and enter long positions. |
| But given that anything can happen in the markets, especially as we go into this long weekend, be mindful of a pullback turning into a reversal and manage your open positions accordingly. |
| Title: | Editor |
| Company: | Technical Analysis of Stocks & Commodities |
| Address: | 4757 California Ave SW |
| Seattle, WA 98116 | |
| Website: | Traders.com |
| E-mail address: | Jayanthi@traders.com |
Traders' Resource Links | |
| Charting the Stock Market: The Wyckoff Method -- Books | |
| Working-Money.com -- Online Trading Services | |
| Traders.com Advantage -- Online Trading Services | |
| Technical Analysis of Stocks & Commodities -- Publications and Newsletters | |
| Working Money, at Working-Money.com -- Publications and Newsletters | |
| Traders.com Advantage -- Publications and Newsletters | |
| Professional Traders Starter Kit -- Software | |
Click here for more information about our publications!
Comments

Request Information From Our Sponsors
- StockCharts.com, Inc.
- Candle Patterns
- Candlestick Charting Explained
- Intermarket Technical Analysis
- John Murphy on Chart Analysis
- John Murphy's Chart Pattern Recognition
- John Murphy's Market Message
- MurphyExplainsMarketAnalysis-Intermarket Analysis
- MurphyExplainsMarketAnalysis-Visual Analysis
- StockCharts.com
- Technical Analysis of the Financial Markets
- The Visual Investor
- VectorVest, Inc.
- Executive Premier Workshop
- One-Day Options Course
- OptionsPro
- Retirement Income Workshop
- Sure-Fire Trading Systems (VectorVest, Inc.)
- Trading as a Business Workshop
- VectorVest 7 EOD
- VectorVest 7 RealTime/IntraDay
- VectorVest AutoTester
- VectorVest Educational Services
- VectorVest OnLine
- VectorVest Options Analyzer
- VectorVest ProGraphics v6.0
- VectorVest ProTrader 7
- VectorVest RealTime Derby Tool
- VectorVest Simulator
- VectorVest Variator
- VectorVest Watchdog
