HOT TOPICS LIST
- MACD
- Fibonacci
- RSI
- Gann
- ADXR
- Stochastics
- Volume
- Triangles
- Futures
- Cycles
- Volatility
- ZIGZAG
- MESA
- Retracement
- Aroon
INDICATORS LIST
LIST OF TOPICS
PRINT THIS ARTICLE
by Andrew Hetherington
Daily, weekly and monthly charts of General Motors (GM) show several long and short-term opportunities, not in the least is the small head and shoulders formation on the daily chart.
Position: N/A
Andrew Hetherington
Classic Dow Theorist who trades as a pure technician, using pattern recognition.
PRINT THIS ARTICLE
CHART ANALYSIS
General Motors Is Spinning Its Wheels
09/10/02 01:46:26 PMby Andrew Hetherington
Daily, weekly and monthly charts of General Motors (GM) show several long and short-term opportunities, not in the least is the small head and shoulders formation on the daily chart.
Position: N/A
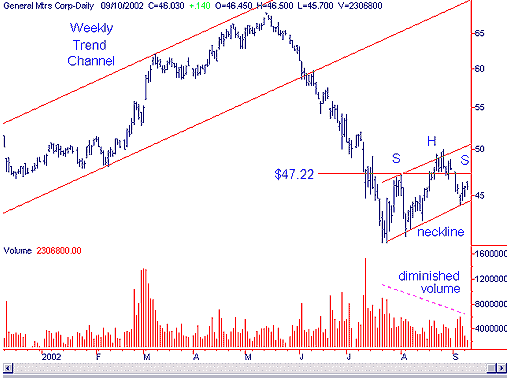
 Figure 1: Daily chart of General Motors. Buying cars and trucks with no money down and zero percent financing has hit General Motors hard. These types of buyer incentives have hurt the bottom line and it shows clearly on the chart. As a pure technician I don't follow the unreliable fundamental information but it's hard not to see the advertisements. |
| On the daily chart in Figure 1 there is a small 2-month head and shoulders pattern forming. This pattern is not yet complete and I'm guessing that the right shoulder will continue slightly higher. The prudent trade seems to be to take a short position in the $47.22 - $49.50 area. This trading within the pattern is risky but can be profitable if correctly forecasted. The neckline is upsloping as I prefer on a head and shoulders top, and will break in the $44.60 area. Even if the head and shoulders forecast is inaccurate, it will still be near the top end of the small trend channel. I don't trade within channels since they can break without notice but there is a little extra supply being dumped at that line just above $50.00 and this extra supply will push the equity down. It definitely seems like a profitable opportunity. |

|
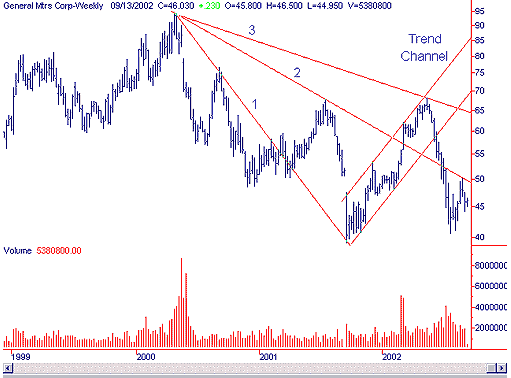
| Figure 2: Weekly chart of GM. |
| Graphic provided by: SuperCharts. |
| |
| On the weekly chart in Figure 2 the fan lines have formed resistance areas. The second fan line will also help push down the equity if there is not sufficient volume to overcome this supply line. |
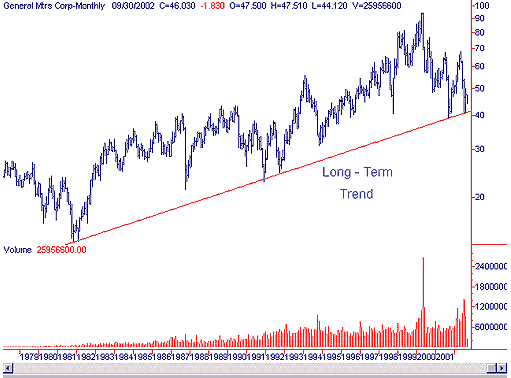
 Figure 3: Monthly chart of GM. The monthly chart of GM (Figure 3) shows that the long-term trend from 1981 is still intact. The trendline is in the $41.00 area and is likely to be broken when the small head and shoulders breaks. Even if it holds temporarily, it will likely break down the road eventually. The $41.00 area is a good place to take the profits off of the table since I am anticipating a hesitation at this line. This hesitation will most likely be brief but capitalizing on your profits is important since the bounce up could erode much of the profit. If you are so inclined, take the profits off of the table in the $41.00 area and short it once again on the bounce up towards the $44.00 area. |
Classic Dow Theorist who trades as a pure technician, using pattern recognition.
| Toronto, Canada |
Click here for more information about our publications!
Comments
Date: 09/11/02Rank: 4Comment: Hi:
My one constructive comment on the text of these analytical evaluations is: please state more clearly SHORTING opportunity, or BUYING opportunity. I just hate to second guess a comment.
Thanks a bunch,
B.H.Peterson
Date: 10/06/02Rank: 3Comment: I was always under the impression that a Head Shoulders pattern is at the end of an upward movement(rally) and not during a downward movement as depicted in Fig. 1(Daily Chart of General Motors - 2002 up 10th of Sept.)
Please advise if this possible. My humble opinion is that this 2-month formation is a rectancle.
Best regards,
Michalis Kaniclides(mkanicl@cytanet.com.cy)

Request Information From Our Sponsors
- StockCharts.com, Inc.
- Candle Patterns
- Candlestick Charting Explained
- Intermarket Technical Analysis
- John Murphy on Chart Analysis
- John Murphy's Chart Pattern Recognition
- John Murphy's Market Message
- MurphyExplainsMarketAnalysis-Intermarket Analysis
- MurphyExplainsMarketAnalysis-Visual Analysis
- StockCharts.com
- Technical Analysis of the Financial Markets
- The Visual Investor
- VectorVest, Inc.
- Executive Premier Workshop
- One-Day Options Course
- OptionsPro
- Retirement Income Workshop
- Sure-Fire Trading Systems (VectorVest, Inc.)
- Trading as a Business Workshop
- VectorVest 7 EOD
- VectorVest 7 RealTime/IntraDay
- VectorVest AutoTester
- VectorVest Educational Services
- VectorVest OnLine
- VectorVest Options Analyzer
- VectorVest ProGraphics v6.0
- VectorVest ProTrader 7
- VectorVest RealTime Derby Tool
- VectorVest Simulator
- VectorVest Variator
- VectorVest Watchdog
