HOT TOPICS LIST
- MACD
- Fibonacci
- RSI
- Gann
- ADXR
- Stochastics
- Volume
- Triangles
- Futures
- Cycles
- Volatility
- ZIGZAG
- MESA
- Retracement
- Aroon
INDICATORS LIST
LIST OF TOPICS
PRINT THIS ARTICLE
by David Penn
What do the triangles at the tops of the yen and euro suggest for the US?
Position: N/A
David Penn
Technical Writer for Technical Analysis of STOCKS & COMMODITIES magazine, Working-Money.com, and Traders.com Advantage.
PRINT THIS ARTICLE
TRIANGLES
Forex Triangle Tops
09/10/02 02:07:23 PMby David Penn
What do the triangles at the tops of the yen and euro suggest for the US?
Position: N/A
| While a compelling case for long-term deterioration of the US dollar can be made (see Gary Grosschadl's "U.S. Dollar Index Pullback Test," Traders.com Advantage, 9/3/02), a case for short-term deterioration of many greenback competitors -- namely, the euro and yen -- might be equally compelling. |
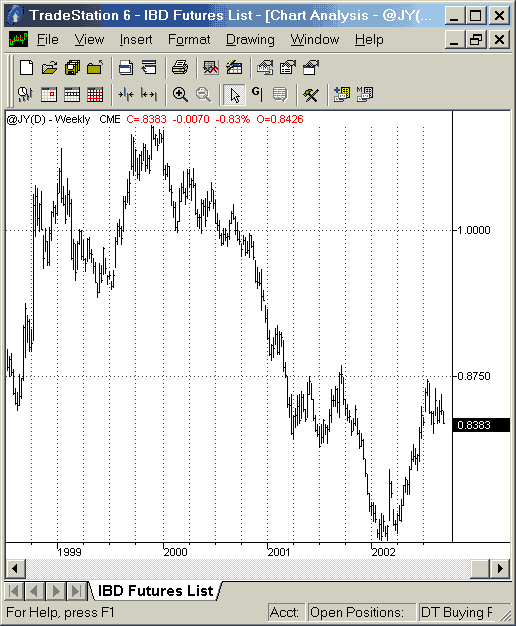
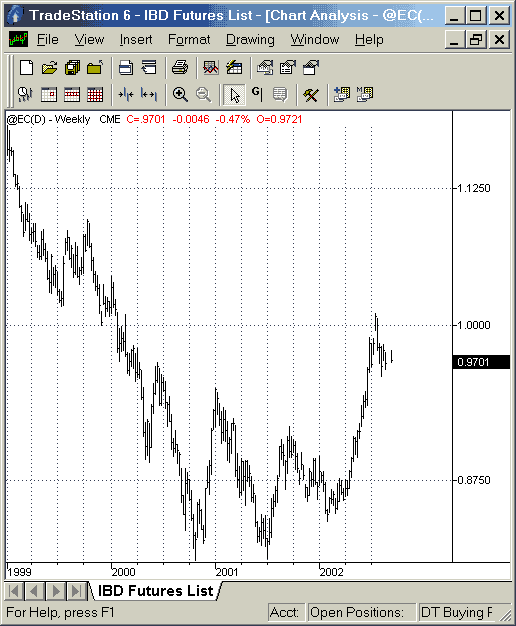
| The US dollar has spent most of 2002 correcting from highs reached at the beginning of the year in the last of a series of tops (Q4 2000; Q2,3 2001; Q1 2002). At the same time, both commodities and foreign currencies have gained. In the case of commodities, a large part of these gains is a rally from the correction that followed the last commodities bull market in 1999 (see my article "Commodities: Soaring Toward Resistance?" Traders.com Advantage, 9/3/02). In the case of foreign currencies, particularly the yen and euro, these gains have not retraced a great deal of the correction from their 1999 peaks: the yen is still down 75% from its 1999 high and the euro is still down 10% from its high (at inception, incidentally) in 1999, as well. Thus, from a longer-term perspective, both currencies have plenty of room (technically, if not politically) to appreciate. |

|
| Figure 1: A long-term look at the yen reveals a two-year bear market. |
| Graphic provided by: TradeStation. |
| |
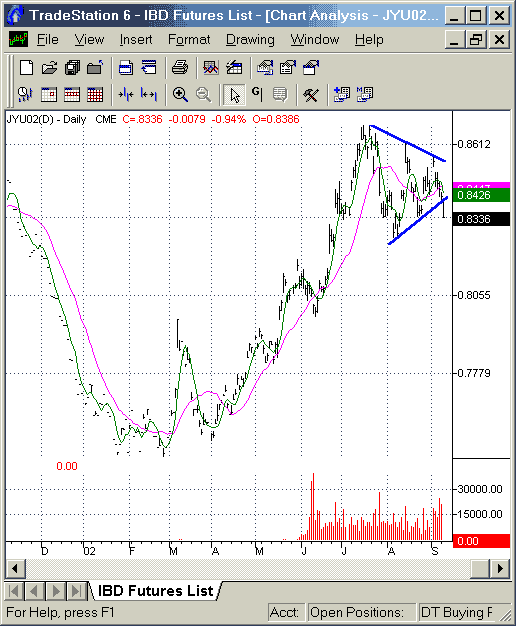
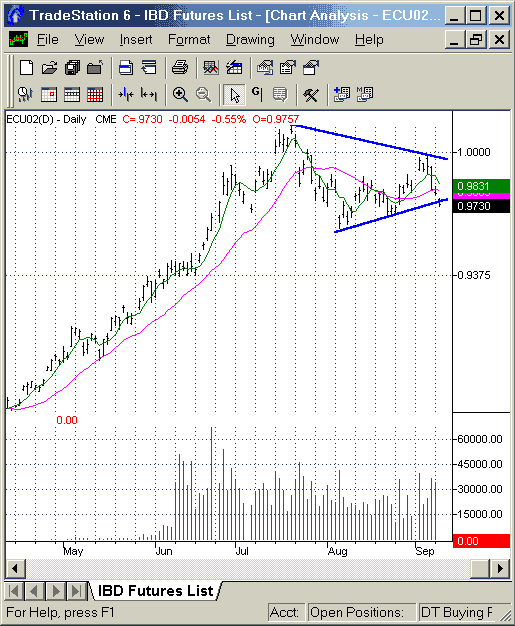
 Figure 2: The long bear market for the euro looks to have finally ended. However, these long-term views also point out the likelihood of these two currencies experiencing a short-term correction. Both the yen and the euro began moving against the US dollar in earnest in the spring of 2002, with the yen gaining 8% year-to-date and the euro gaining 11%. Yet charts of both currencies reveal a pair of triangle tops that currently threaten these rallies. |
 Figure 3: This triangle top may have put an end to the rally in the yen. The triangle top in the Japanese yen is perhaps the most interesting of the two -- in part because it appears to already be breaking down and in part because of the obvious preference on the part of the Japanese government to have a lower priced yen. The size of this triangle top suggests, should the yen continue to break, a downside target of around 0.8009. This would likely mean a retest of the June 2002 lows, and would represent a steep, though not necessarily bull market killing, correction. |
 Figure 4: Will this triangle top in the euro also break on the downside? The triangle top in the euro has yet to break, although it already bears an uncanny resemblance to the triangle top in the yen. Similarly, a break from this triangle top would make for a significant correction -- likely to the 0.9222 area, which is in the neighborhood of the June 2002 lows. On a tangential note, it is interesting to me that the proposed corrections in the Japanese yen and in the euro do not take out the most previous rally highs on the long-term charts (Figures 1 and 2 above). The (late) Q1 2002 rally peak in the yen is at about the same level as the downside break target from its triangle top, and the (late) Q3 2001 rally peak in the euro looks poised to provide support as well if that downside break target is accurate. This should be of particular interest to those building long-term wave counts on these two currencies, but all those looking for possible long-term bullish opportunities in the yen and euro should keep this in mind, as well. |
Technical Writer for Technical Analysis of STOCKS & COMMODITIES magazine, Working-Money.com, and Traders.com Advantage.
| Title: | Technical Writer |
| Company: | Technical Analysis, Inc. |
| Address: | 4757 California Avenue SW |
| Seattle, WA 98116 | |
| Phone # for sales: | 206 938 0570 |
| Fax: | 206 938 1307 |
| Website: | www.Traders.com |
| E-mail address: | DPenn@traders.com |
Traders' Resource Links | |
| Charting the Stock Market: The Wyckoff Method -- Books | |
| Working-Money.com -- Online Trading Services | |
| Traders.com Advantage -- Online Trading Services | |
| Technical Analysis of Stocks & Commodities -- Publications and Newsletters | |
| Working Money, at Working-Money.com -- Publications and Newsletters | |
| Traders.com Advantage -- Publications and Newsletters | |
| Professional Traders Starter Kit -- Software | |
Click here for more information about our publications!
Comments
Date: 09/17/02Rank: 5Comment:
Date: 08/09/03Rank: 5Comment:

|

Request Information From Our Sponsors
- StockCharts.com, Inc.
- Candle Patterns
- Candlestick Charting Explained
- Intermarket Technical Analysis
- John Murphy on Chart Analysis
- John Murphy's Chart Pattern Recognition
- John Murphy's Market Message
- MurphyExplainsMarketAnalysis-Intermarket Analysis
- MurphyExplainsMarketAnalysis-Visual Analysis
- StockCharts.com
- Technical Analysis of the Financial Markets
- The Visual Investor
- VectorVest, Inc.
- Executive Premier Workshop
- One-Day Options Course
- OptionsPro
- Retirement Income Workshop
- Sure-Fire Trading Systems (VectorVest, Inc.)
- Trading as a Business Workshop
- VectorVest 7 EOD
- VectorVest 7 RealTime/IntraDay
- VectorVest AutoTester
- VectorVest Educational Services
- VectorVest OnLine
- VectorVest Options Analyzer
- VectorVest ProGraphics v6.0
- VectorVest ProTrader 7
- VectorVest RealTime Derby Tool
- VectorVest Simulator
- VectorVest Variator
- VectorVest Watchdog
