HOT TOPICS LIST
- MACD
- Fibonacci
- RSI
- Gann
- ADXR
- Stochastics
- Volume
- Triangles
- Futures
- Cycles
- Volatility
- ZIGZAG
- MESA
- Retracement
- Aroon
INDICATORS LIST
LIST OF TOPICS
PRINT THIS ARTICLE
by Gary Grosschadl
The USD at a critical point here and outcome may influence overall indices as market confidence also reflected in the strength or weakness of the greenback.
Position: N/A
Gary Grosschadl
Independent Canadian equities trader and technical analyst based in Peterborough
Ontario, Canada.
PRINT THIS ARTICLE
CHART ANALYSIS
US Dollar Index Pullback Test
09/03/02 04:05:05 PMby Gary Grosschadl
The USD at a critical point here and outcome may influence overall indices as market confidence also reflected in the strength or weakness of the greenback.
Position: N/A
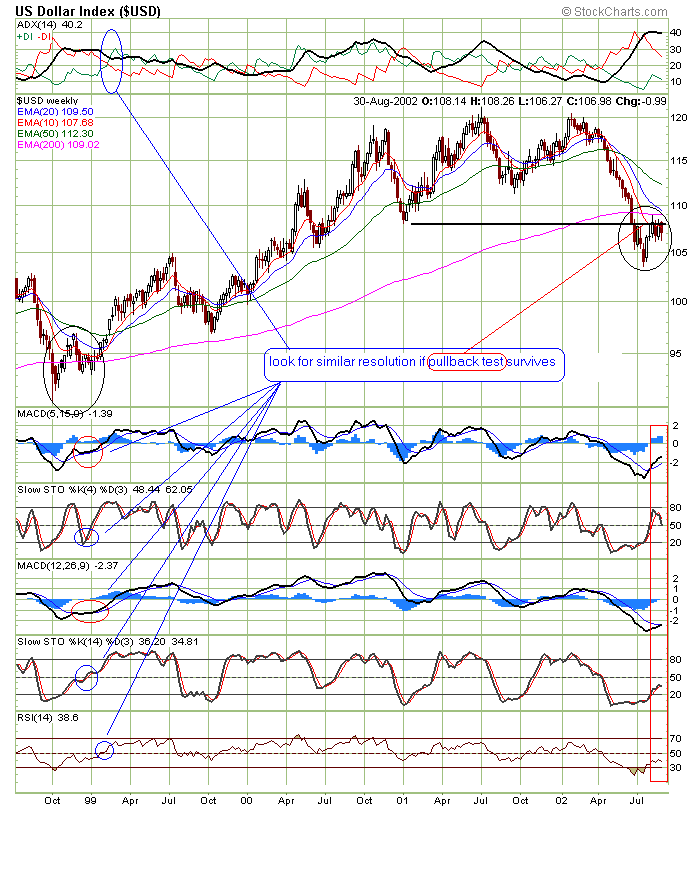
| This weekly chart shows a hefty bearish move after a double top was put in. This was especially bearish as the USD crashed through 200 EMA ~ 109 and a previous support level ~ 108. Now like many other charts, this results in a pullback test to these same levels 108 - 109. The outcome of this pullback test is still undecided. After briefly touching the 200 EMA, it looks potentially stalled here in this resistance zone between 108-109 |
| To help determine what might happen next you can look back at a similar instance at the beginning of 1999. At that time there was a similar collapse to below 200 EMA and the nature of that recovery can give clues to this resolution. In 1999 there was a 6 week rally that was halted by 20 EMA resistance which resulted in a 2 week retracement followed by a much bigger upleg. In a similar fashion you see a 6 week upmove (last 4 weeks being sideways) and wait for further resolution. |

|
| Graphic provided by: stockcharts.com. |
| |
| The indicators suggest that several things should happen for a convincing upleg from here. A move up should be accompanied by directional movement switching to bullish mode via a DI crossover (the top indicator chart ADX) resulting in the green +DI moving above the red -DI. Both MACD series should continue to rise and not stall at the 0 line. The (4)(3) stochastic should reverse from lower levels while the longer term (14)(3) should make a sustained move above the 50 level. Finally the Relative Strength Index (RSI) should show good strength by rising and staying above the 50 level. |
| If this pullback test fails, beware a close below 106 (recent support) as this may lead to a test of previous lows. The main indices would likely suffer the same fate. Failure of USD to rise above its 200 EMA resistance would make any further rise in the Dow or Nasdaq suspect, that is if it is not already an anchor holding these indices down. |
Independent Canadian equities trader and technical analyst based in Peterborough
Ontario, Canada.
| Website: | www.whatsonsale.ca/financial.html |
| E-mail address: | gwg7@sympatico.ca |
Click here for more information about our publications!
Comments
Date: 09/11/02Rank: 4Comment:
Date: 09/18/02Rank: 3Comment:

|

Request Information From Our Sponsors
- StockCharts.com, Inc.
- Candle Patterns
- Candlestick Charting Explained
- Intermarket Technical Analysis
- John Murphy on Chart Analysis
- John Murphy's Chart Pattern Recognition
- John Murphy's Market Message
- MurphyExplainsMarketAnalysis-Intermarket Analysis
- MurphyExplainsMarketAnalysis-Visual Analysis
- StockCharts.com
- Technical Analysis of the Financial Markets
- The Visual Investor
- VectorVest, Inc.
- Executive Premier Workshop
- One-Day Options Course
- OptionsPro
- Retirement Income Workshop
- Sure-Fire Trading Systems (VectorVest, Inc.)
- Trading as a Business Workshop
- VectorVest 7 EOD
- VectorVest 7 RealTime/IntraDay
- VectorVest AutoTester
- VectorVest Educational Services
- VectorVest OnLine
- VectorVest Options Analyzer
- VectorVest ProGraphics v6.0
- VectorVest ProTrader 7
- VectorVest RealTime Derby Tool
- VectorVest Simulator
- VectorVest Variator
- VectorVest Watchdog
