HOT TOPICS LIST
- MACD
- Fibonacci
- RSI
- Gann
- ADXR
- Stochastics
- Volume
- Triangles
- Futures
- Cycles
- Volatility
- ZIGZAG
- MESA
- Retracement
- Aroon
INDICATORS LIST
LIST OF TOPICS
PRINT THIS ARTICLE
by David Penn
The break from an intraday diamond formation should tell traders and investors all they need to know about the S&P 500's near-term direction.
Position: N/A
David Penn
Technical Writer for Technical Analysis of STOCKS & COMMODITIES magazine, Working-Money.com, and Traders.com Advantage.
PRINT THIS ARTICLE
THE DIAMOND
The S&P 500's Make or Break Diamond
09/06/02 10:05:59 AMby David Penn
The break from an intraday diamond formation should tell traders and investors all they need to know about the S&P 500's near-term direction.
Position: N/A
| The plot of the S&P 500 gets thicker. Increasing numbers of informed commentators -- as opposed to the perma-bulls -- have been growing more and more bearish. The "rally is dead" say these insightful observers -- and they are not entirely without evidence. The rally that began at the end of July has started to roll over, breaking through an initial trendline that connected the July 24th lows to what I considered a successful test of bottom on August 6th. |
| There's no fading the bearishness of an outright trendline break, but a look at the intraday action in the S&P 500 suggests that there may be more resilience to the S&P 500's rally than otherwise thought. I introduced this notion in a previous Traders.com Advantage article, "The S&P500's Other Head and Shoulders Top", suggesting further that the downside from this intraday head and shoulders top might measure the extent of the correction in the July-August-September rally in the S&P 500. |

|
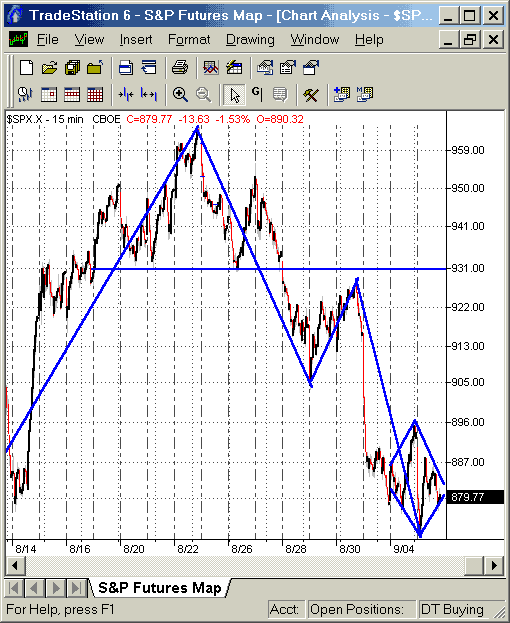
| This head and shoulders top in the 15-minute bar chart breaks down into a diamond formation in early September. |
| Graphic provided by: TradeStation. |
| |
| I had anticipated a downside breakout to around 897 back on August 28th, with the S&P 500 trading around 914.50. While the S&P 500 has moved even further down -- the correction low is about 870.50 -- I note that the S&P 500 has remained in a relatively comfortable range between 896.50 and 870.50, allowing the index to consolidate a bit while new leadership -- bullish or bearish -- emerges. I was particularly struck by the diamond-shaped nature of the consolidation at the beginning of September. |
| What does this diamond pattern suggest? Given the size of the diamond -- approximately 26 points -- we can prepare for a break in either direction of approximately that magnitude. A 26-point upside break -- assuming a breakout point around 883 -- would take the S&P 500 to a retest of the highs of early August (around 922). A 26-point break on the downside would take the S&P 500 down to a test of major support (penultimate support, arguably) in the 845-840 range. |
| While such a downside break would probably bring all the bears out of the forest, I do think that as long as support holds at 840, then any correction to that point might actually be a welcome move. Rallies in bear markets tend to come when pessimism is at a peak. While the current round of hand-wringing is a helpful reflection of fear and anxiety about the markets, a test of the 845-840 range would quite possibly be the scare needed to get this countertrend rally rolling in earnest. |
Technical Writer for Technical Analysis of STOCKS & COMMODITIES magazine, Working-Money.com, and Traders.com Advantage.
| Title: | Technical Writer |
| Company: | Technical Analysis, Inc. |
| Address: | 4757 California Avenue SW |
| Seattle, WA 98116 | |
| Phone # for sales: | 206 938 0570 |
| Fax: | 206 938 1307 |
| Website: | www.Traders.com |
| E-mail address: | DPenn@traders.com |
Traders' Resource Links | |
| Charting the Stock Market: The Wyckoff Method -- Books | |
| Working-Money.com -- Online Trading Services | |
| Traders.com Advantage -- Online Trading Services | |
| Technical Analysis of Stocks & Commodities -- Publications and Newsletters | |
| Working Money, at Working-Money.com -- Publications and Newsletters | |
| Traders.com Advantage -- Publications and Newsletters | |
| Professional Traders Starter Kit -- Software | |
Click here for more information about our publications!
Comments
Date: 09/08/02Rank: 4Comment:
Date: 09/10/02Rank: 5Comment:
Date: 09/21/02Rank: 1Comment:

Request Information From Our Sponsors
- StockCharts.com, Inc.
- Candle Patterns
- Candlestick Charting Explained
- Intermarket Technical Analysis
- John Murphy on Chart Analysis
- John Murphy's Chart Pattern Recognition
- John Murphy's Market Message
- MurphyExplainsMarketAnalysis-Intermarket Analysis
- MurphyExplainsMarketAnalysis-Visual Analysis
- StockCharts.com
- Technical Analysis of the Financial Markets
- The Visual Investor
- VectorVest, Inc.
- Executive Premier Workshop
- One-Day Options Course
- OptionsPro
- Retirement Income Workshop
- Sure-Fire Trading Systems (VectorVest, Inc.)
- Trading as a Business Workshop
- VectorVest 7 EOD
- VectorVest 7 RealTime/IntraDay
- VectorVest AutoTester
- VectorVest Educational Services
- VectorVest OnLine
- VectorVest Options Analyzer
- VectorVest ProGraphics v6.0
- VectorVest ProTrader 7
- VectorVest RealTime Derby Tool
- VectorVest Simulator
- VectorVest Variator
- VectorVest Watchdog
