HOT TOPICS LIST
- MACD
- Fibonacci
- RSI
- Gann
- ADXR
- Stochastics
- Volume
- Triangles
- Futures
- Cycles
- Volatility
- ZIGZAG
- MESA
- Retracement
- Aroon
INDICATORS LIST
LIST OF TOPICS
PRINT THIS ARTICLE
by Gary Grosschadl
Many gold stocks are surging higher as the XAU beats the 200-EMA resistance level.
Position: N/A
Gary Grosschadl
Independent Canadian equities trader and technical analyst based in Peterborough
Ontario, Canada.
PRINT THIS ARTICLE
CHART ANALYSIS
XAU Gold Index Ready To Surpass Pullback Target
08/28/02 04:25:17 PMby Gary Grosschadl
Many gold stocks are surging higher as the XAU beats the 200-EMA resistance level.
Position: N/A
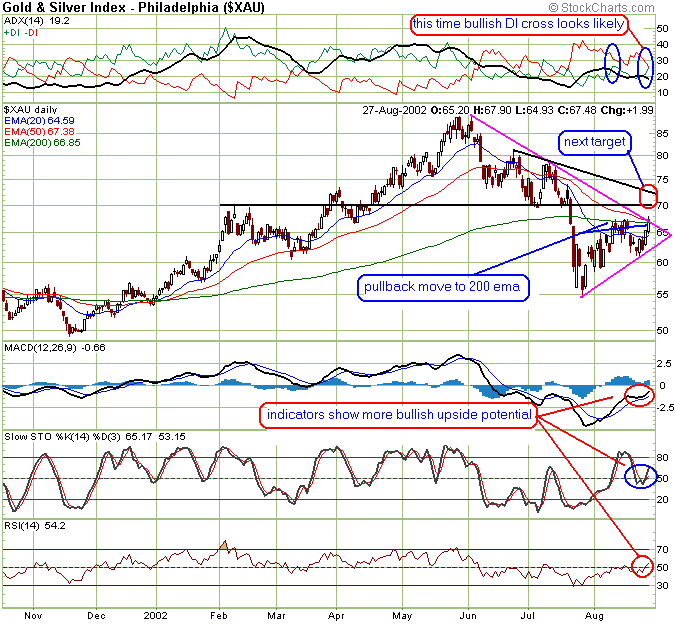
| In a previous analysis (7/30/02) I suggested this index could make a pullback move back up to test the 200-EMA. This has occurred twice in the past 2 weeks and this time it looks good to go higher. After the initial pullback move appeared to fail, many traders were prepared for a larger downleg only to have the XAU reverse once again to challenge that resistance line for another bullish assault. |
| After 2 bullish candles culminated with a close just above 200-EMA we also see several indicators hint at further bullish upside ahead. The ADX indicator shows a bullish DI cross is imminent unlike the last time where it balked. The other displayed indicators show more upside potential as well. Note the bullish "skip" on the MACD series where the MACD refused to do a bearish cross during the last XAU downleg. This was a very bullish sign going forward. |

|
| Graphic provided by: stockcharts.com. |
| |
| The next target level on this chart is the 70 - 72 zone which encompasses previous resistance and support levels and a trendline test at ~ 72. Resistance here may coincide with stochastics topping out and possible MACD failure / balk at the 0 level. Should the XAU regroup here and hold support above the 200-EMA, preferably above 68, then another bullish thrust is possible towards the 80 level. |
| The downside risk would be a move below the lower trendline as shown on the chart. Prudent traders may want to place their protective stops accordingly. The gold markets remain volatile and reversal oriented but do represent trading opportunites. |
Independent Canadian equities trader and technical analyst based in Peterborough
Ontario, Canada.
| Website: | www.whatsonsale.ca/financial.html |
| E-mail address: | gwg7@sympatico.ca |
Click here for more information about our publications!
Comments
Date: 09/02/02Rank: 5Comment:
Date: 09/03/02Rank: 5Comment:
Date: 09/03/02Rank: 5Comment:

Request Information From Our Sponsors
- StockCharts.com, Inc.
- Candle Patterns
- Candlestick Charting Explained
- Intermarket Technical Analysis
- John Murphy on Chart Analysis
- John Murphy's Chart Pattern Recognition
- John Murphy's Market Message
- MurphyExplainsMarketAnalysis-Intermarket Analysis
- MurphyExplainsMarketAnalysis-Visual Analysis
- StockCharts.com
- Technical Analysis of the Financial Markets
- The Visual Investor
- VectorVest, Inc.
- Executive Premier Workshop
- One-Day Options Course
- OptionsPro
- Retirement Income Workshop
- Sure-Fire Trading Systems (VectorVest, Inc.)
- Trading as a Business Workshop
- VectorVest 7 EOD
- VectorVest 7 RealTime/IntraDay
- VectorVest AutoTester
- VectorVest Educational Services
- VectorVest OnLine
- VectorVest Options Analyzer
- VectorVest ProGraphics v6.0
- VectorVest ProTrader 7
- VectorVest RealTime Derby Tool
- VectorVest Simulator
- VectorVest Variator
- VectorVest Watchdog
