HOT TOPICS LIST
- MACD
- Fibonacci
- RSI
- Gann
- ADXR
- Stochastics
- Volume
- Triangles
- Futures
- Cycles
- Volatility
- ZIGZAG
- MESA
- Retracement
- Aroon
INDICATORS LIST
LIST OF TOPICS
PRINT THIS ARTICLE
by Gary Grosschadl
The $XAU gold index collapsed with a triple failure and this has set up a possible trading opportunity.
Position: N/A
Gary Grosschadl
Independent Canadian equities trader and technical analyst based in Peterborough
Ontario, Canada.
PRINT THIS ARTICLE
GOLD & METALS
Short Term Opportunity in Gold
07/30/02 09:32:53 AMby Gary Grosschadl
The $XAU gold index collapsed with a triple failure and this has set up a possible trading opportunity.
Position: N/A
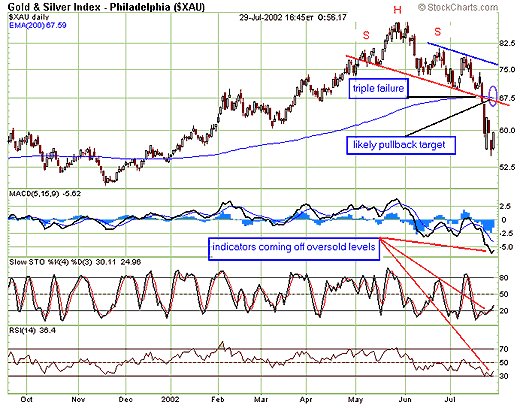
| The chart below shows the quick and severe action that occured when three important areas were breached simultaneously. The various flag formations and 200-day EMA (exponential moving average) support both failed dramatically. Upon closer examination there is also a slanted head and shoulders failure. When this crucial level failed, traders just had too many reasons to sell. |
| Now as traders see the $XAU is at oversold levels and are somewhat reassured that the $300 price of gold will hold, a trading opportunity seems to be at hand. However pattern readers can readily see the danger and opportunity that lies ahead. |

|
| Graphic provided by: stockcharts.com. |
| |
| Traders that spot the slanted head and shoulders formation can assume a likely strategy. Often a topping formation can exhibit a pullback test, especially the head and shoulders. This pullback can bring the index back to its trendline and this can be a crucial point. Failure or success is the thing to watch as either one can be significant. On the upside, should the $XAU push its way past the neckline and 200-day EMA, then this would be a very bullish signal pointing to additional upside. However should the normal pattern of pullback failure occur, then the downside implications can produce a sizable move that traders can capitalize on as well --shorting gold or at least bailing out of profitable previous positions. |
| An important caveat is that the price of gold must hold above $300. |
Independent Canadian equities trader and technical analyst based in Peterborough
Ontario, Canada.
| Website: | www.whatsonsale.ca/financial.html |
| E-mail address: | gwg7@sympatico.ca |
Click here for more information about our publications!
Comments
Date: 07/30/02Rank: 5Comment:
Date: 07/31/02Rank: 4Comment:
Date: 08/06/02Rank: 5Comment:
Date: 08/06/02Rank: 4Comment:
Date: 08/06/02Rank: Comment: I use a different method, sans charts, but my assessment is the same with the note that I think it will happen.

Request Information From Our Sponsors
- StockCharts.com, Inc.
- Candle Patterns
- Candlestick Charting Explained
- Intermarket Technical Analysis
- John Murphy on Chart Analysis
- John Murphy's Chart Pattern Recognition
- John Murphy's Market Message
- MurphyExplainsMarketAnalysis-Intermarket Analysis
- MurphyExplainsMarketAnalysis-Visual Analysis
- StockCharts.com
- Technical Analysis of the Financial Markets
- The Visual Investor
- VectorVest, Inc.
- Executive Premier Workshop
- One-Day Options Course
- OptionsPro
- Retirement Income Workshop
- Sure-Fire Trading Systems (VectorVest, Inc.)
- Trading as a Business Workshop
- VectorVest 7 EOD
- VectorVest 7 RealTime/IntraDay
- VectorVest AutoTester
- VectorVest Educational Services
- VectorVest OnLine
- VectorVest Options Analyzer
- VectorVest ProGraphics v6.0
- VectorVest ProTrader 7
- VectorVest RealTime Derby Tool
- VectorVest Simulator
- VectorVest Variator
- VectorVest Watchdog
