HOT TOPICS LIST
- MACD
- Fibonacci
- RSI
- Gann
- ADXR
- Stochastics
- Volume
- Triangles
- Futures
- Cycles
- Volatility
- ZIGZAG
- MESA
- Retracement
- Aroon
INDICATORS LIST
LIST OF TOPICS
PRINT THIS ARTICLE
by David Penn
Diamond continuation patterns act as distribution areas in declining trends.
Position: N/A
David Penn
Technical Writer for Technical Analysis of STOCKS & COMMODITIES magazine, Working-Money.com, and Traders.com Advantage.
PRINT THIS ARTICLE
DAY TRADING
Diamonds in the Intraday S&P 500
08/26/02 04:35:34 PMby David Penn
Diamond continuation patterns act as distribution areas in declining trends.
Position: N/A
| Like many traders and trading-oriented analysts, I spend a large part of each day monitoring the S&P futures. The role of these futures in helping traders develop an opinion about the general market and specific stocks notwithstanding, it is always helpful to have a few favorite stocks or indexes that you study faithfully. During the raging bull market, stock screens were especially popular and I dare say it was largely because it really didn't matter a great deal which stocks you picked. I'm being somewhat facetious, of course, but that's how bull markets operate: all boats with a minimum of buoyancy get lifted when the tide rises. The only trick is in finding the best floating boat. However, in the bear market, a little more discretion is in order, and one of the best ways to develop that discretion is by focusing on a few highly traded, highly liquid stocks or exchange-traded funds. |
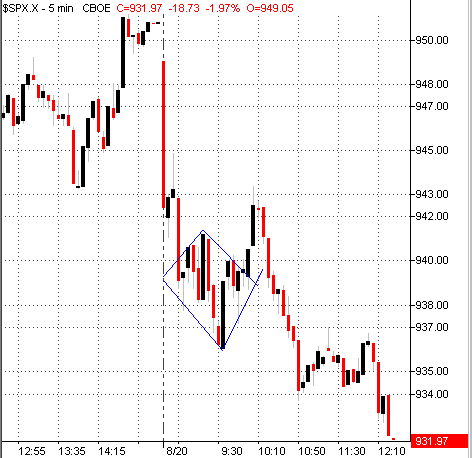
| That said, I've been watching how a number of early intraday declines in the S&P 500 fell into diamond-shaped consolidations before moving on to mark the day's lows. While it is true that diamond patterns are often reversals (I've noted diamond reversal patterns this year in gold - see "Gold's Diamond Bottom" Traders.com Advantage, 5/28/02 - for example), I am increasingly finding diamonds as continuation patterns worthy of note. The first case involves the diamond that formed early in the trading day on August 20th. The S&P 500 gapped down on the open and, after a brief pause, resumed its strong downward trend. Over the next hour and a half, the S&P 500 consolidated between about 941 and 936. This consolidation took on a classic diamond shape: a tight price range that expands to a larger price range before contracting again. I often look for the tell-tale spike to the upside followed shortly by a spike to the downside (the other can be reversed, of course) that helps shape the diamond pattern. Generally speaking, breakouts from diamonds run into some resistance at the top of the pattern and support at the bottom and, generally, this serves as a fairly reliable guide to trading diamonds. However, look at what happens in the August 20th morning diamond. |

|
| A false breakout from this intraday diamond reverses to send prices lower. The only tip-off was the possibility of resistance from the price congestion following the opening move down. |
| Graphic provided by: TradeStation. |
| |
| In this diamond, note how prices move up (if not away) from the diamond breakout area of about 939.50. The size of the diamond suggests an upside of anywhere between 945 and 946, but the breakout fails just above 942. Not only does the breakout fail, but it also reverses itself and begins moving downward, beneath both the breakout area and the support area at the bottom of the diamond. Here, prices move swiftly to the downside objective of 934 (formation size subtracted from value at breakout), before moving into yet another consolidation. Following this consolidation, prices headed even lower. Successfully navigating an intraday diamond such as the one above may make trading the next diamond seem like a walk in the park. Here, the challenge was a downside price objective that was not met initially, and a strong counter-breakout advance that might have shaken a few traders out of their positions prematurely. |
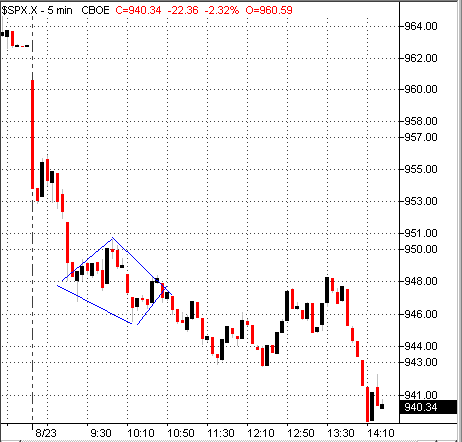
 The breakout fails to reach its downside target in the first decline, but after a strong pullback, the diamond's downside target is hit. Given the size of this August 23rd diamond and its breakout point, a downside target of about 941 seems reasonable. As with the August 20th diamond, prices gapped down and, after a brief consolidation, fell a bit more before moving into the diamond-shaped consolidation. Note again the shape: the small range growing larger, then contracting again. In this case, there was no "fake-out" to the upside; there was little doubt that the breakout from this diamond - once down - would stay down. Unfortunately, prices fell to 943 - just shy of our price target - before rebounding twice, nearly reaching the breakout point. In fact, the rally from the second low in the noon hour was strong enough to take the S&P 500 past the breakout point of the diamond. But patience, at least in this case, was well-rewarded. Assuming a trader kept a close but sufficiently distance stop-buy near the entry point (around 948) for the intraday short, the rally that took place in the one o'clock hour would have been a bit scary, but nothing to worry about. The rally just barely tipped over 948 before reversing and, with all haste, beginning to move lower. The 943 area that had acted as such strong support earlier in the day gave way as prices gapped through that level to head even lower. Needless to say, the price objective was reached. |
| Whether or not diamond patterns (or any pattern, for that matter) are actually tradable on an intraday basis is up to the individual trader. There are many top-notch traders who use patterns such as these as indicators, but not for executing actual trades. I find studying chart patterns on an intraday basis to be an excellent way of honing pattern recognition skills, not the least because of the speed with which patterns are confirmed or rejected (fail). If chart patterns are a part of your regular trading arsenal, then consider looking at intraday time frames as well as your regular time frames; you may find your skills as a chart reader and trader are better than you think. |
Technical Writer for Technical Analysis of STOCKS & COMMODITIES magazine, Working-Money.com, and Traders.com Advantage.
| Title: | Technical Writer |
| Company: | Technical Analysis, Inc. |
| Address: | 4757 California Avenue SW |
| Seattle, WA 98116 | |
| Phone # for sales: | 206 938 0570 |
| Fax: | 206 938 1307 |
| Website: | www.Traders.com |
| E-mail address: | DPenn@traders.com |
Traders' Resource Links | |
| Charting the Stock Market: The Wyckoff Method -- Books | |
| Working-Money.com -- Online Trading Services | |
| Traders.com Advantage -- Online Trading Services | |
| Technical Analysis of Stocks & Commodities -- Publications and Newsletters | |
| Working Money, at Working-Money.com -- Publications and Newsletters | |
| Traders.com Advantage -- Publications and Newsletters | |
| Professional Traders Starter Kit -- Software | |
Click here for more information about our publications!
Comments
Date: 08/28/02Rank: 5Comment:

Request Information From Our Sponsors
- VectorVest, Inc.
- Executive Premier Workshop
- One-Day Options Course
- OptionsPro
- Retirement Income Workshop
- Sure-Fire Trading Systems (VectorVest, Inc.)
- Trading as a Business Workshop
- VectorVest 7 EOD
- VectorVest 7 RealTime/IntraDay
- VectorVest AutoTester
- VectorVest Educational Services
- VectorVest OnLine
- VectorVest Options Analyzer
- VectorVest ProGraphics v6.0
- VectorVest ProTrader 7
- VectorVest RealTime Derby Tool
- VectorVest Simulator
- VectorVest Variator
- VectorVest Watchdog
- StockCharts.com, Inc.
- Candle Patterns
- Candlestick Charting Explained
- Intermarket Technical Analysis
- John Murphy on Chart Analysis
- John Murphy's Chart Pattern Recognition
- John Murphy's Market Message
- MurphyExplainsMarketAnalysis-Intermarket Analysis
- MurphyExplainsMarketAnalysis-Visual Analysis
- StockCharts.com
- Technical Analysis of the Financial Markets
- The Visual Investor
