HOT TOPICS LIST
- MACD
- Fibonacci
- RSI
- Gann
- ADXR
- Stochastics
- Volume
- Triangles
- Futures
- Cycles
- Volatility
- ZIGZAG
- MESA
- Retracement
- Aroon
INDICATORS LIST
LIST OF TOPICS
PRINT THIS ARTICLE
by David Penn
Nearly four years in the making, is the diamond bottom in gold a sign of higher prices to come?
Position: N/A
David Penn
Technical Writer for Technical Analysis of STOCKS & COMMODITIES magazine, Working-Money.com, and Traders.com Advantage.
PRINT THIS ARTICLE
GOLD & METALS
Gold's Diamond Bottom
05/28/02 08:39:08 AMby David Penn
Nearly four years in the making, is the diamond bottom in gold a sign of higher prices to come?
Position: N/A
| While many gold bugs have been bemoaning the lack of commentary on the yellow metal on finance-oriented gabfests like CNBC, the fact of the matter is that more and more people have been paying attention to gold ever since it rose above--and, to date, has remained above--$300 per ounce. This $300 an ounce price is a far cry from the $400/ounce gold of the mid-1990s, much less the vertigo-inducing gold prices of the early 1980s. But the fact that gold has been in a bear market since a spike in 1987 has more and more people looking eagerly to signs that gold may be finally picking itself off the canvas. |
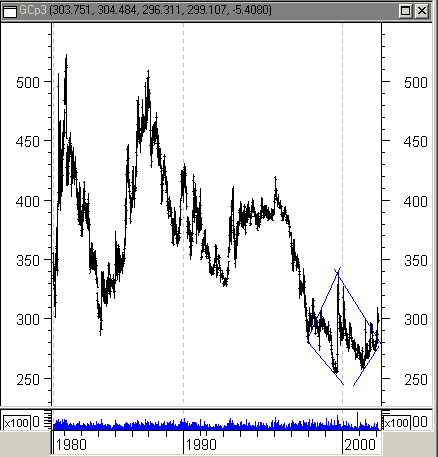
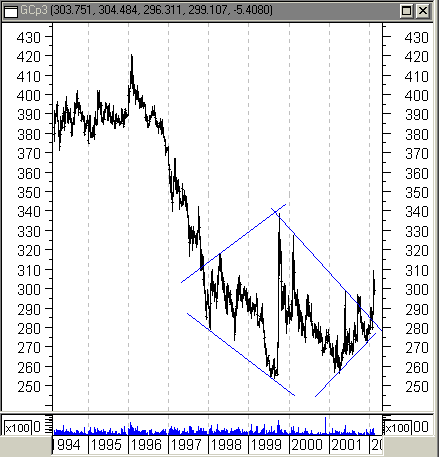
| I've suggested elsewhere ("A Bull Market in Gold?" and "Intermarket Gold-Digging," January 2002 Traders.com Advantage articles) that gold may have bottomed in mid-1999 and appears to have successfully tested that bottom with the declines in early 2001. In between these two troughs, gold, as measured by the continuous futures contract, spiked strongly in the third quarter of 1999 to test (unsuccessfully) the previous bear market rally peak of about 345 reached in 1997. A second spike very early in 2000 failed to surpass the earlier 1999 rally before correcting down into what came to be the aforementioned test of the mid-1999 bottom. |

|
| A breakout from this diamond bottom could send gold continuous futures as high as 350. |
| Graphic provided by: MetaStock. |
| |
| Looked at from the perspective of the past 20 years, the idea of a bottom in gold is all the more compelling. In particular, the price action of gold futures--the two spikes in mid-1999 and 2000 and the bottom tests in late 1999 and early 2001--have established a diamond bottom formation, a chart pattern that tends to suggest a reversal in price action may be around the corner. This diamond bottom has a top of about 340, a bottom of about 250, and looks to be breaking out early in 2002 at about 280. Deriving a price target for this formation is relatively straightforward: add the formation size (90 in this case) to the value at the breakout point (280). This suggests a likely minimum target of about 350. |
 Should prices move up and away from this diamond bottom, a test of the bear market rally high between 345 and 350 would be next. It is important to remember the context here--a chart looking at the past 20 years of price action in gold continuous futures--as well as the duration of the chart pattern itself, which is approximately four years long. This suggests that gold bulls may have a year or more before gold reaches its target. At the same time, as the chart shows, price moves in gold are characterized by sharp sudden advances and relatively (emphasis on "relatively") restrained declines. Note the rapid gold advances between 1985 and 1987 (79%) and the sharp, but smaller spike in the year 1993 (24%). That is to say that although the size of the diamond bottom suggests that a year to eighteen months is the likely time it would take gold prices to reach their minimum objective, gold frequently has proven itself to be capable of moving much faster than many expect. |
Technical Writer for Technical Analysis of STOCKS & COMMODITIES magazine, Working-Money.com, and Traders.com Advantage.
| Title: | Technical Writer |
| Company: | Technical Analysis, Inc. |
| Address: | 4757 California Avenue SW |
| Seattle, WA 98116 | |
| Phone # for sales: | 206 938 0570 |
| Fax: | 206 938 1307 |
| Website: | www.Traders.com |
| E-mail address: | DPenn@traders.com |
Traders' Resource Links | |
| Charting the Stock Market: The Wyckoff Method -- Books | |
| Working-Money.com -- Online Trading Services | |
| Traders.com Advantage -- Online Trading Services | |
| Technical Analysis of Stocks & Commodities -- Publications and Newsletters | |
| Working Money, at Working-Money.com -- Publications and Newsletters | |
| Traders.com Advantage -- Publications and Newsletters | |
| Professional Traders Starter Kit -- Software | |
Click here for more information about our publications!
PRINT THIS ARTICLE

Request Information From Our Sponsors
- StockCharts.com, Inc.
- Candle Patterns
- Candlestick Charting Explained
- Intermarket Technical Analysis
- John Murphy on Chart Analysis
- John Murphy's Chart Pattern Recognition
- John Murphy's Market Message
- MurphyExplainsMarketAnalysis-Intermarket Analysis
- MurphyExplainsMarketAnalysis-Visual Analysis
- StockCharts.com
- Technical Analysis of the Financial Markets
- The Visual Investor
- VectorVest, Inc.
- Executive Premier Workshop
- One-Day Options Course
- OptionsPro
- Retirement Income Workshop
- Sure-Fire Trading Systems (VectorVest, Inc.)
- Trading as a Business Workshop
- VectorVest 7 EOD
- VectorVest 7 RealTime/IntraDay
- VectorVest AutoTester
- VectorVest Educational Services
- VectorVest OnLine
- VectorVest Options Analyzer
- VectorVest ProGraphics v6.0
- VectorVest ProTrader 7
- VectorVest RealTime Derby Tool
- VectorVest Simulator
- VectorVest Variator
- VectorVest Watchdog
