HOT TOPICS LIST
- MACD
- Fibonacci
- RSI
- Gann
- ADXR
- Stochastics
- Volume
- Triangles
- Futures
- Cycles
- Volatility
- ZIGZAG
- MESA
- Retracement
- Aroon
INDICATORS LIST
LIST OF TOPICS
PRINT THIS ARTICLE
by Andrew Hetherington
If you are holding this equity in a long position, the time is right to abandon your long holdings and go short.
Position: N/A
Andrew Hetherington
Classic Dow Theorist who trades as a pure technician, using pattern recognition.
PRINT THIS ARTICLE
CHART ANALYSIS
United Technologies Corporation Will Not be Flying High for Much Longer
08/06/02 08:14:51 AMby Andrew Hetherington
If you are holding this equity in a long position, the time is right to abandon your long holdings and go short.
Position: N/A
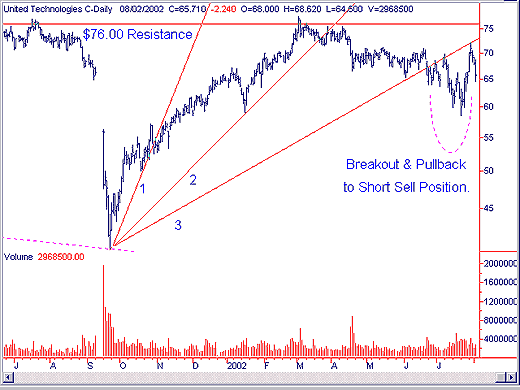
 Figure 1: Daily chart of United Technologies (UTX). The daily chart for United Technologies Corporation (UTX) shows a recent third fan line break in the $67.00 area that occured on June 21. Following that, there was the usual pullback up to the line in the $69.74 area on July 8th. A fast drop ensued, which is customary on third fan line breaks, to the $59.90 area on July 15th. A second pullback to the fan line occured on July 30th, up to a high of $72.06 on lighter volume than recent activity, which was also expected. Some may argue, incorrectly, that this is a rounding top or a head and shoulders in the making; unfortunately volume does not confirm either pattern. The descent ensued and the inevitable assault on lower levels is upon us. If you are holding this equity in a long position, the time is right to abandon your long holdings and go short. |

|
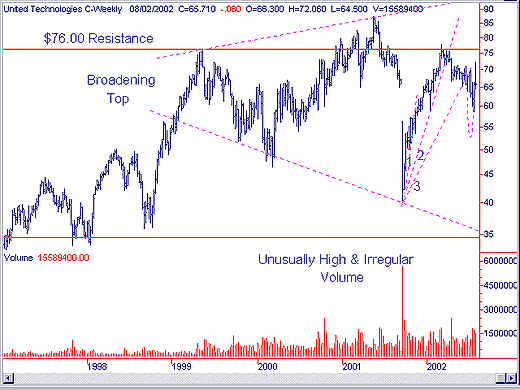
| Figure 2: Weekly chart of UTX. |
| Graphic provided by: SuperCharts. |
| |
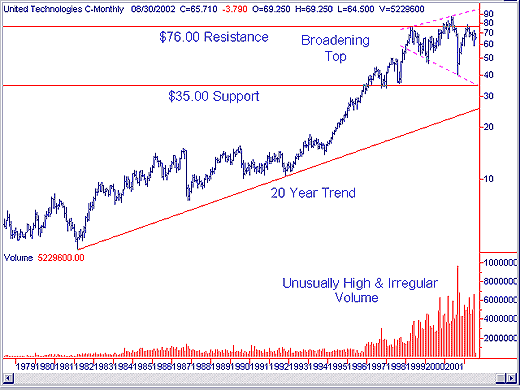
 Figure 3: Monthly chart of UTX. |
| The daily chart did not have a pattern other than the fan lines. However, the weekly chart illustrates a more ominous picture with a broadening top. This broadening top is three and a half years in the making. It's huge! The style is very similar to that on the Dow Industrials Index, which I discussed in another article called "The Dow Explanation." The top end of this pattern is relatively close and taking out medium-term short positions will prove to be a prudent trade a few months down the road. Naturally, it may react more abruptly, and the short-term speculator will also be rewarded. This downward move will go to $40.10 as a minimum where the previous bottom was in September. When this happens it will likely decide to drop through the bottom line on this formation, which is currently in the $35.00 area, and test the 20-year trendline at the $25.00 area. This all seems difficult to grasp but remember that all equities don't react at the same time. On the ride down, if it doesn't drive through the previous bottom of $40.10, then buy back your short or sell your options. Place a buy stop just above the third fan line in the event it goes in the opposite direction. |
| My suggestion for those who are long and don't want to bail out is to hedge their position with some "put" options. This will protect against any downside risk that seems inevitable. Others that have the spirit will enjoy taking out some "leaps." These put options cost a little more since you have a longer term time horizon, but if you decide to play outside the money a little, in the $50.00 or $55.00 strike area for January 2003, you will be rewarded handsomely. Of course, this is speculation at this time, but a gamble of $1.50 or $2.00 per option should see quite an appreciation if my prognostication is correct. |
Classic Dow Theorist who trades as a pure technician, using pattern recognition.
| Toronto, Canada |
Click here for more information about our publications!
Comments
Date: 08/13/02Rank: 5Comment:

Request Information From Our Sponsors
- StockCharts.com, Inc.
- Candle Patterns
- Candlestick Charting Explained
- Intermarket Technical Analysis
- John Murphy on Chart Analysis
- John Murphy's Chart Pattern Recognition
- John Murphy's Market Message
- MurphyExplainsMarketAnalysis-Intermarket Analysis
- MurphyExplainsMarketAnalysis-Visual Analysis
- StockCharts.com
- Technical Analysis of the Financial Markets
- The Visual Investor
- VectorVest, Inc.
- Executive Premier Workshop
- One-Day Options Course
- OptionsPro
- Retirement Income Workshop
- Sure-Fire Trading Systems (VectorVest, Inc.)
- Trading as a Business Workshop
- VectorVest 7 EOD
- VectorVest 7 RealTime/IntraDay
- VectorVest AutoTester
- VectorVest Educational Services
- VectorVest OnLine
- VectorVest Options Analyzer
- VectorVest ProGraphics v6.0
- VectorVest ProTrader 7
- VectorVest RealTime Derby Tool
- VectorVest Simulator
- VectorVest Variator
- VectorVest Watchdog
