HOT TOPICS LIST
- MACD
- Fibonacci
- RSI
- Gann
- ADXR
- Stochastics
- Volume
- Triangles
- Futures
- Cycles
- Volatility
- ZIGZAG
- MESA
- Retracement
- Aroon
INDICATORS LIST
LIST OF TOPICS
PRINT THIS ARTICLE
by Andrew Hetherington
Throughout these past two difficult years Wal-Mart (WMT) has held up considerably well. As WMT approaches its September low it is difficult to believe it will smash through this area, but it will happen.
Position: N/A
Andrew Hetherington
Classic Dow Theorist who trades as a pure technician, using pattern recognition.
PRINT THIS ARTICLE
ROUND TOP & BOTTOM
Rounding Top at Wal-Mart
08/06/02 10:56:37 AMby Andrew Hetherington
Throughout these past two difficult years Wal-Mart (WMT) has held up considerably well. As WMT approaches its September low it is difficult to believe it will smash through this area, but it will happen.
Position: N/A
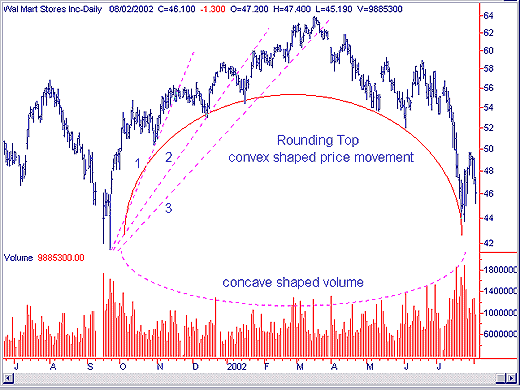
 Figure 1: Daily chart of Wal-Mart (WMT) |
| The daily chart shown above has a third fan line break in the $62.00 area that occured on March 21st. This signaled the end to the uptrend, and long positions should have been discarded. At that juncture, I was able to presuppose a head and shoulders or rounding top was forming. The volume was diminished on the way upward to give an early indication of ID (impending doom) to come. Then the volume increases on the way down. This concave shaped volume pattern along with a convex shaped price pattern confirms a rounding top. |

|
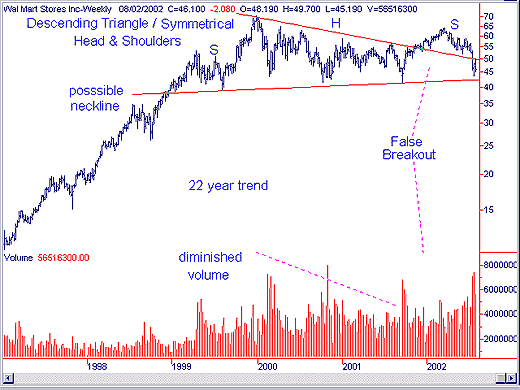
| Figure 2: Weekly chart of Wal-Mart. |
| Graphic provided by: SuperCharts. |
| |
| The weekly chart has a triangle or a head and shoulders pattern. If it is a head and shoulders pattern then it is not completed yet. However, I prefer to see it as a symmetrical triangle with a false breakout. This false move is distinguishable by the light volume. Instead of having a gradual pickup in activity leading to a burst on the breakout, there is a burst off the bottom and diminished volume on the breakout. It climbs back within the pattern since there is no interest. It could linger inside the pattern or even squeeze out through the apex and drift sideways, but I believe it will drop much farther after breaking on the downside of the symmetrical triangle. My prognostication is for this equity to eventually see $26.00-$27.00. |
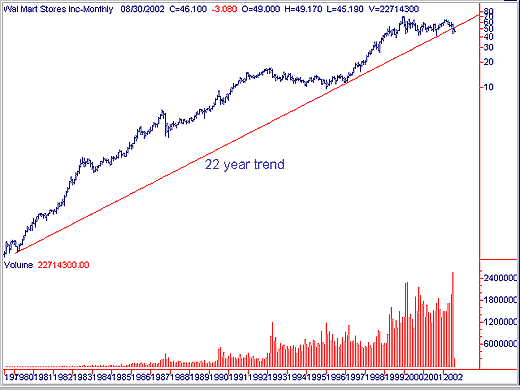
 Figure 3: Monthy chart of WMT. The monthly chart illustrates where the 22-year trend was broken. This took place 13 days ago in the $50.00 area. The natural pullback to this line was an appropriate time to take new short positions given the change in trend. How do we know it is only a reaction? The volume is lighter on the way up and this trendline pulls it back upwards. The laws of supply and demand are at work in this scenario. |
Classic Dow Theorist who trades as a pure technician, using pattern recognition.
| Toronto, Canada |
Click here for more information about our publications!
Comments
Date: 08/06/02Rank: 5Comment:
Date: 08/06/02Rank: 5Comment: can you analyze $VIX concave formation over two years time frame?
Date: 08/06/02Rank: 5Comment:
Date: 08/12/02Rank: 5Comment:
Date: 08/12/02Rank: 5Comment:
Date: 08/13/02Rank: 5Comment:
Date: 08/13/02Rank: 4Comment:
Date: 08/13/02Rank: 4Comment: To take advantage of the trend shown, what time frame would you suggest for shorting--and what time frame chart should I be following?
Thanks a bunch,
bpeterson81@cox.net

Request Information From Our Sponsors
- StockCharts.com, Inc.
- Candle Patterns
- Candlestick Charting Explained
- Intermarket Technical Analysis
- John Murphy on Chart Analysis
- John Murphy's Chart Pattern Recognition
- John Murphy's Market Message
- MurphyExplainsMarketAnalysis-Intermarket Analysis
- MurphyExplainsMarketAnalysis-Visual Analysis
- StockCharts.com
- Technical Analysis of the Financial Markets
- The Visual Investor
- VectorVest, Inc.
- Executive Premier Workshop
- One-Day Options Course
- OptionsPro
- Retirement Income Workshop
- Sure-Fire Trading Systems (VectorVest, Inc.)
- Trading as a Business Workshop
- VectorVest 7 EOD
- VectorVest 7 RealTime/IntraDay
- VectorVest AutoTester
- VectorVest Educational Services
- VectorVest OnLine
- VectorVest Options Analyzer
- VectorVest ProGraphics v6.0
- VectorVest ProTrader 7
- VectorVest RealTime Derby Tool
- VectorVest Simulator
- VectorVest Variator
- VectorVest Watchdog
