HOT TOPICS LIST
- MACD
- Fibonacci
- RSI
- Gann
- ADXR
- Stochastics
- Volume
- Triangles
- Futures
- Cycles
- Volatility
- ZIGZAG
- MESA
- Retracement
- Aroon
INDICATORS LIST
LIST OF TOPICS
PRINT THIS ARTICLE
by Andrew Hetherington
After breaking below its symmetrical triangle formation, the stock price for Centex Corporation (CTX) looks to be headed towards its intermediate-term trendline.
Position: N/A
Andrew Hetherington
Classic Dow Theorist who trades as a pure technician, using pattern recognition.
PRINT THIS ARTICLE
FALSE MOVES
A False Breakout For Centex Corporation
08/05/02 10:17:41 AMby Andrew Hetherington
After breaking below its symmetrical triangle formation, the stock price for Centex Corporation (CTX) looks to be headed towards its intermediate-term trendline.
Position: N/A
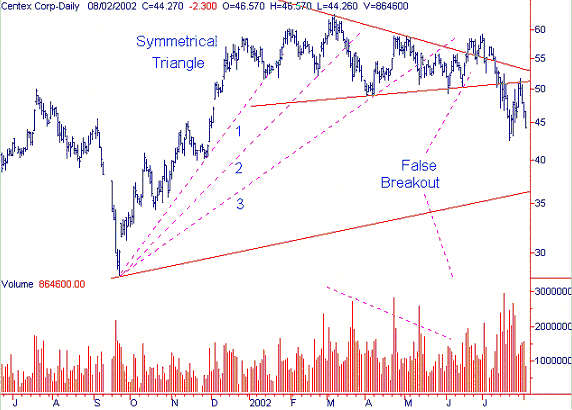
| Looking at Figure 1 we have the daily chart for Centex Corporation (CTX). There is a 5-month symmetrical triangle with a false breakout topside. This false break was not accompanied with a significant increase in volume and therefore could not be trusted. The volume on the triangle diminished throughout the construction of the pattern. In addition, there was a third fan line break on May 10, changing the temporary direction from up to down. The typical pullback to the fan line then occured in the $58.00 area. This was the false breakout. The inevitable downturn ensued since there was no money chasing it higher. The breakout on the downside from the symmetrical triangle began in the $51.00 area and continued as low as $42.61. |

|
| Figure 1: Daily chart for CTX. |
| Graphic provided by: SuperCharts. |
| |
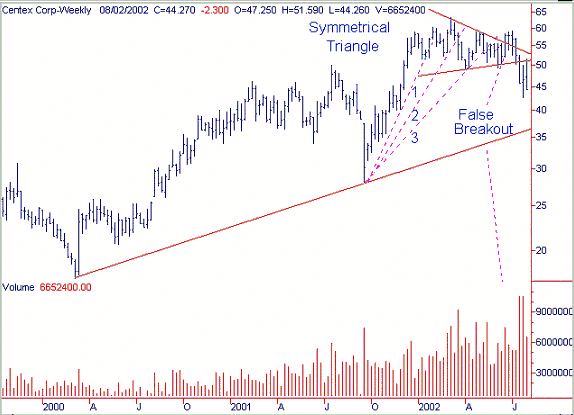
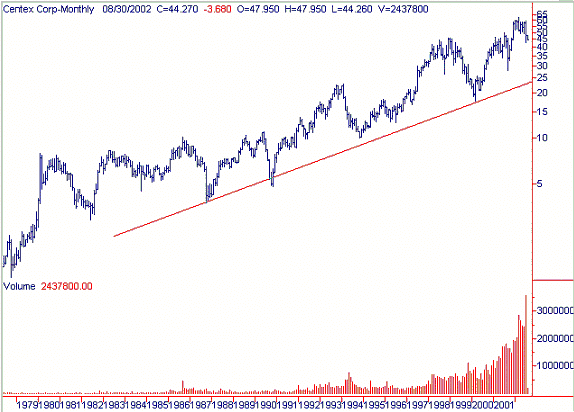
| There was another pullback to the triangle line in the $51.00 area where taking a short position would have been a good safe trade, given the pattern confirmation. In addition, the major indices showed trend cooperation, with the Dow topping out in the 8807 area. The ride down should go to at least $40.00 and most likely to the intermediate-term trend in the $37.00 area, which is illustrated in the weekly chart of Figure 2. The long-term trend is in the $25.00 area which can been seen on the monthly chart in Figure 3. |
 Figure 2: Weekly chart for CTX.  Figure 3: Monthly chart for CTX. |
Classic Dow Theorist who trades as a pure technician, using pattern recognition.
| Toronto, Canada |
Click here for more information about our publications!
Comments
Date: 08/06/02Rank: 5Comment:
Date: 08/17/02Rank: 5Comment:

Request Information From Our Sponsors
- StockCharts.com, Inc.
- Candle Patterns
- Candlestick Charting Explained
- Intermarket Technical Analysis
- John Murphy on Chart Analysis
- John Murphy's Chart Pattern Recognition
- John Murphy's Market Message
- MurphyExplainsMarketAnalysis-Intermarket Analysis
- MurphyExplainsMarketAnalysis-Visual Analysis
- StockCharts.com
- Technical Analysis of the Financial Markets
- The Visual Investor
- VectorVest, Inc.
- Executive Premier Workshop
- One-Day Options Course
- OptionsPro
- Retirement Income Workshop
- Sure-Fire Trading Systems (VectorVest, Inc.)
- Trading as a Business Workshop
- VectorVest 7 EOD
- VectorVest 7 RealTime/IntraDay
- VectorVest AutoTester
- VectorVest Educational Services
- VectorVest OnLine
- VectorVest Options Analyzer
- VectorVest ProGraphics v6.0
- VectorVest ProTrader 7
- VectorVest RealTime Derby Tool
- VectorVest Simulator
- VectorVest Variator
- VectorVest Watchdog
