HOT TOPICS LIST
- MACD
- Fibonacci
- RSI
- Gann
- ADXR
- Stochastics
- Volume
- Triangles
- Futures
- Cycles
- Volatility
- ZIGZAG
- MESA
- Retracement
- Aroon
INDICATORS LIST
LIST OF TOPICS
PRINT THIS ARTICLE
by Andrew Hetherington
The ascending triangle formation on the chart for GATX Corp. (GMT) broke to the downside back in June. What has happened since and where will it go from here?
Position: N/A
Andrew Hetherington
Classic Dow Theorist who trades as a pure technician, using pattern recognition.
PRINT THIS ARTICLE
CHART ANALYSIS
GATX Corporation is Losing Steam
08/02/02 11:49:02 AMby Andrew Hetherington
The ascending triangle formation on the chart for GATX Corp. (GMT) broke to the downside back in June. What has happened since and where will it go from here?
Position: N/A
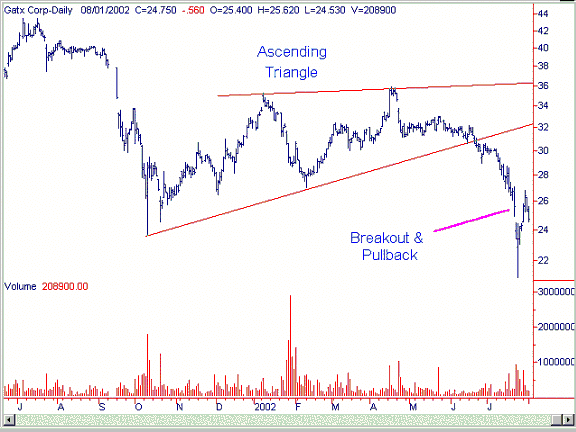
| The daily chart in Figure 1 demonstrates a 9-month ascending triangle with a downside breakout. Although these patterns have a tendency to be bullish, in a bad market there is a "take no prisoners" attitude. The breakout begins in the $31.24 area and drops hard to $21.00 in only one month. This is a significant move for this equity since it has a tendency to be a slow mover. It tends to drop hard only when the Dow Transportation Index goes down hard. The volume on the triangle is diminished but not perfectly diminishing since there are a few spikes in January to make it less than perfect. There is the usual pullback to the sell short position in the $26.82 area, which coincided with the Dow topping out temporarily at my resistance line in the 8900 areas that I discussed in my previous article, "The Dow Explanation". The Dow has reached as high as 8807 on this pullback, which is very near my top end line on the broadening pattern. I don't anticipate the Dow to go higher than 8900 and therefore shorting this equity is playing with the trend. |

|
| Figure 1: Daily chart for GMT. |
| Graphic provided by: SuperCharts. |
| |
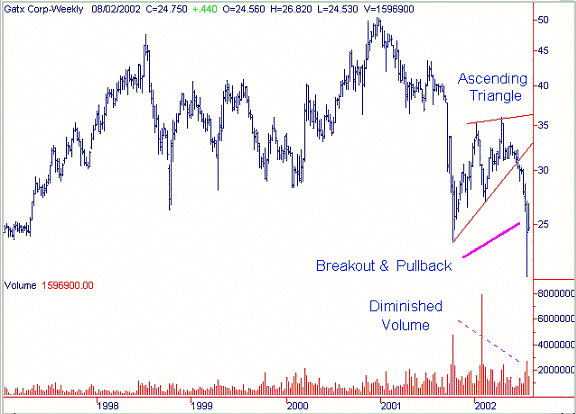
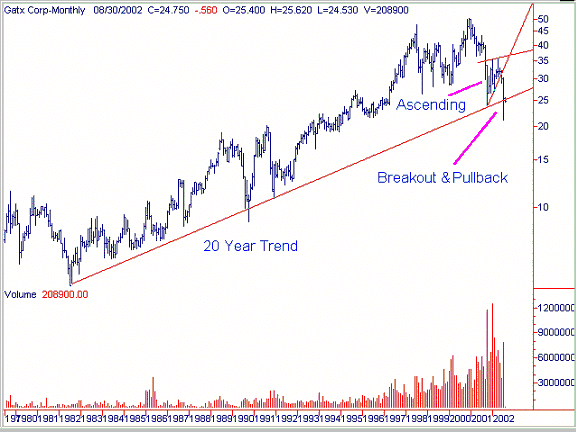
Looking at the weekly and monthly charts in Figures 2 and 3 we see that the volume is easier to distinguish. In particular, the monthly chart clearly shows the diminished volume. In addition, the monthly chart illustrates the soon to be broken 20 year trend line in the $25.00 area. Anticipating this reaction up to the line was a safe bet since this line had already been breached when it nipped below it recently to the $21.00 area. This pullback is a natural occurrence given the strength of this support, which will soon become the resistance line. A downward move to the $19.00 area seems likely and perhaps even lower eventually.  Figure 2: Weekly chart for GMT.  Figure 3: Monthly chart for GMT. |
Classic Dow Theorist who trades as a pure technician, using pattern recognition.
| Toronto, Canada |
Click here for more information about our publications!
PRINT THIS ARTICLE

|

Request Information From Our Sponsors
- StockCharts.com, Inc.
- Candle Patterns
- Candlestick Charting Explained
- Intermarket Technical Analysis
- John Murphy on Chart Analysis
- John Murphy's Chart Pattern Recognition
- John Murphy's Market Message
- MurphyExplainsMarketAnalysis-Intermarket Analysis
- MurphyExplainsMarketAnalysis-Visual Analysis
- StockCharts.com
- Technical Analysis of the Financial Markets
- The Visual Investor
- VectorVest, Inc.
- Executive Premier Workshop
- One-Day Options Course
- OptionsPro
- Retirement Income Workshop
- Sure-Fire Trading Systems (VectorVest, Inc.)
- Trading as a Business Workshop
- VectorVest 7 EOD
- VectorVest 7 RealTime/IntraDay
- VectorVest AutoTester
- VectorVest Educational Services
- VectorVest OnLine
- VectorVest Options Analyzer
- VectorVest ProGraphics v6.0
- VectorVest ProTrader 7
- VectorVest RealTime Derby Tool
- VectorVest Simulator
- VectorVest Variator
- VectorVest Watchdog
